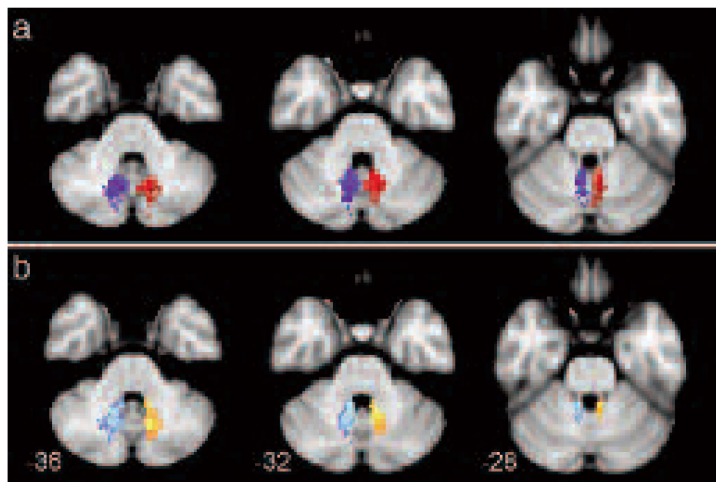
Figure 3.
Axial views of the mean cerebello-thalamo-cortical pathways, across all subjects, thresholded at 80% of subjects.
Each tract is shown with a different color: left and right pathways are orange and light blue when b0 images were used, while they are red and blue when TDI maps were used. Numbers correspond to the z coordinate (in mm) of each axial slice in MNI space.

