
FIGURE 1:
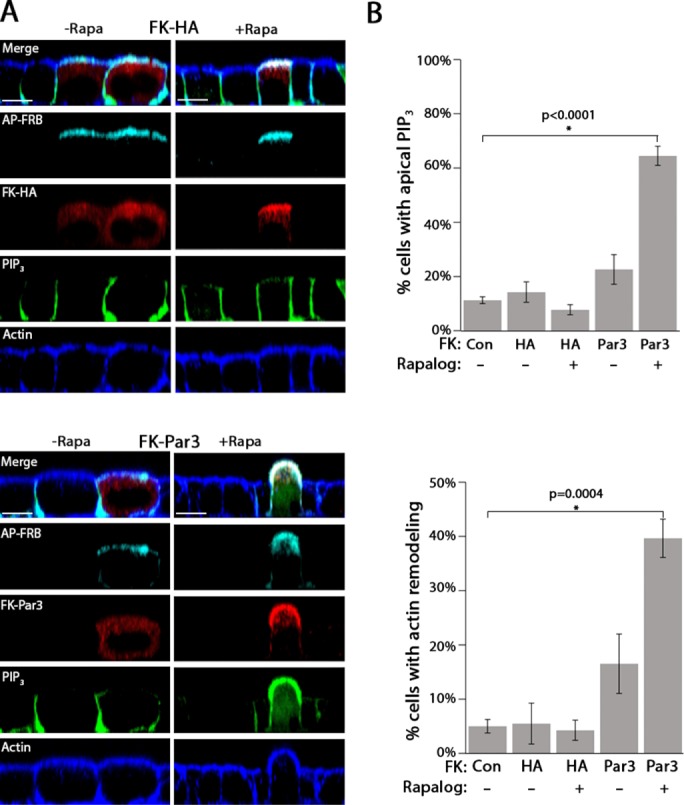
Par3 drives apical membrane remodeling. (A) Single XZ-slice from a confocal micrograph of MDCK cells expressing PH-Akt-GFP (PIP3; green) transfected with AP-FRB (cyan; FLAG) and either FK-HA or FK-Par3 (red; HA) treated with vehicle (–Rapa) or 200 nM Rapalog (+Rapa) for 60 min. Actin was visualized with phalloidin staining (blue). (B) Quantitation of apical PIP3 and actin rearrangement in control cells (not expressing a construct) or cells expressing FK-HA or FK-Par3 in the presence or absence of Rapalog (see Materials and Methods for details). Error bars, SEM. The p value was determined by one-way ANOVA followed by post hoc Tukey’s test. n = 4. Scale bar, 10 µm.