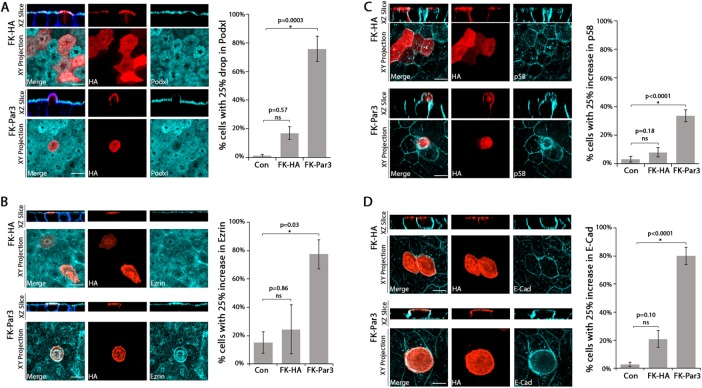
FIGURE 2:
Forced apical targeting of Par3 changes the distribution of proteins at the apical membrane. Confocal images (single XZ-slice and maximum intensity XY-projection) showing the apical surface intensity of PodxI (A), ezrin (B), p58 (C), or E-cadherin (D; cyan) in MDCK cells transfected with AP-FRB and either FK-HA (red, HA) or FK-Par3 (red, HA) and treated with 200 nM Rapalog for 60 min. Actin was visualized with phalloidin staining (blue). The bar graphs show quantitation (see Materials and Methods for details). Cells with >25% drop (PodxI) or >25% increase (Ezrin, E-Cadherin, p58) in the indicated marker were scored as positive. Error bars, SEM. The p value was determined by one-way ANOVA followed by post hoc Tukey’s test. n ≥ 3. Scale bar, 10 µm.

