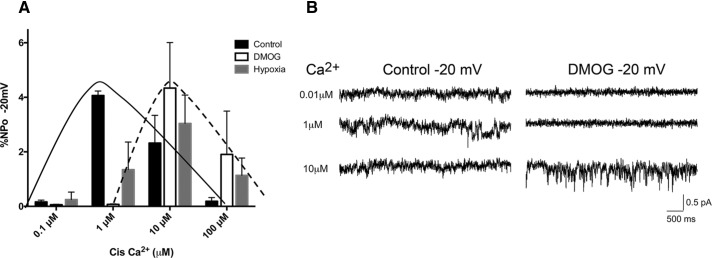
FIGURE 3:
EGLN activity regulates PC channel activity. (A) Single-channel recording performed on microsomes isolated from LLC-PK1 cells overexpressing PC1 and PC2 and incubated under control conditions, in hypoxia for 2 h, or with 1 mM DMOG 24 h; the solid line highlights the Ca2+ sensitivity pattern of channel activity in control conditions, and the dashed line outlines the shift in Ca2+ sensitivity induced by DMOG and hypoxia treatments. The O2 effect on channel activity is statistically significant; p = 0.0018 as assessed by two-way analysis of variance. (B) Representative traces of Ca2+ currents recorded using microsomes isolated from cells overexpressing PC1 and PC2 that were untreated or treated for 24 h with 1 mM DMOG. Data are representative of three different microsome preparations.

