FIGURE 1:
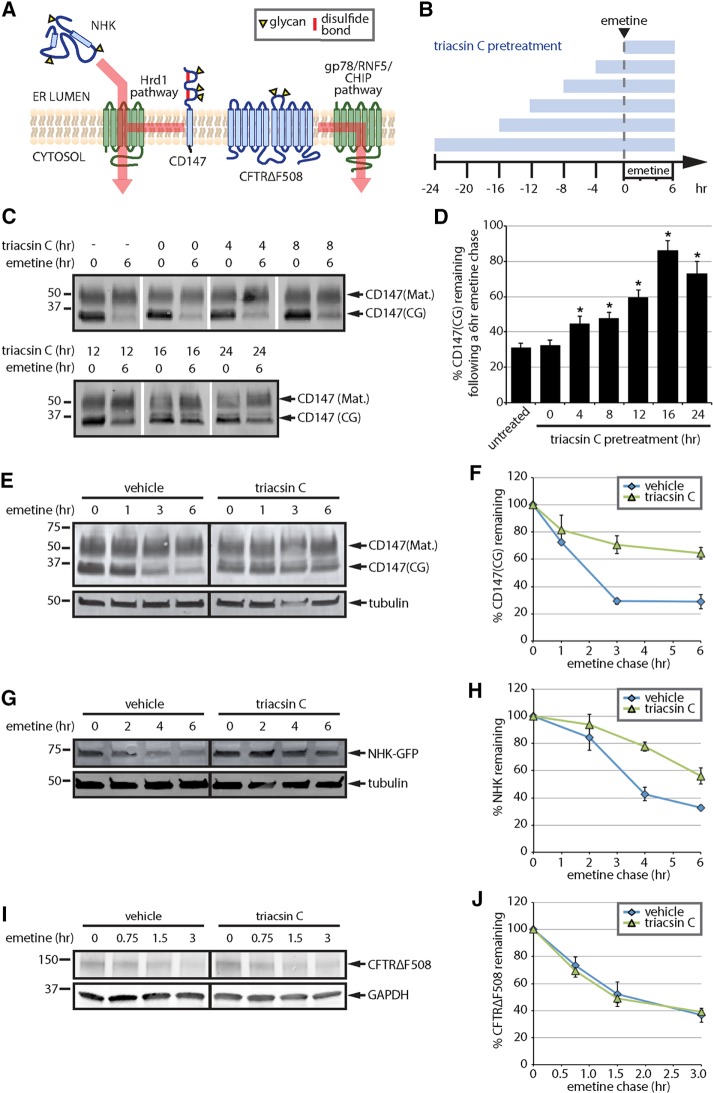
Triacsin C inhibits a subset of ERAD pathways. (A) ERAD substrate panel, indicating substrate topology and degradation pathway(s). Substrates are indicated in blue and ERAD components in green. Yellow triangles indicate N-linked glycans. (B) Triacsin C treatment time course. Triacsin C was added for the indicated times (blue bars) and maintained in the medium throughout the emetine chase. (C) HEK293 cells were pretreated with 1 µg/ml triacsin C for the indicated times (as depicted in B), followed by addition of 75 µM emetine for 6 h. CD147 levels were assessed by immunoblotting of SDS lysates. (D) The relative CD147(CG) levels in C were quantified and are presented as percentage of the levels at time 0 h (n = 3). Asterisk indicates significant stabilization (p < 0.05). (E) HEK293 cells were pretreated with vehicle or 1 µg/ml triacsin C for 16 h, followed by 75 µM emetine for the indicated times. CD147 levels were assessed by immunoblotting of SDS lysates. (F) The relative levels of CD147(CG) in E were quantified and are presented as percentage of the levels at time 0 h (n = 3). (G) HEK293 cells expressing NHK-GFP were pretreated with vehicle or 1 µg/ml triacsin C for 16 h, followed by 75 µM emetine for the indicated times. NHK-GFP levels were assessed by immunoblotting of SDS lysates. (H) The relative levels of NHK-GFP in G were quantified and are presented as percentage of the levels at time 0 h (n = 3). (I) HEK293 cells expressing CFTR∆F508 were pretreated with vehicle or 1 µg/ml triacsin C for 16 h, followed by 75 µM emetine for the indicated times. CFTR∆F508 levels were assessed by immunoblotting of SDS lysates. (J) The relative levels of CFTR∆F508 in I were quantified and are presented as percentage of the levels at time 0 h (n = 4). Mat., mature; CG, core glycosylated. Error bars indicate SEM.

