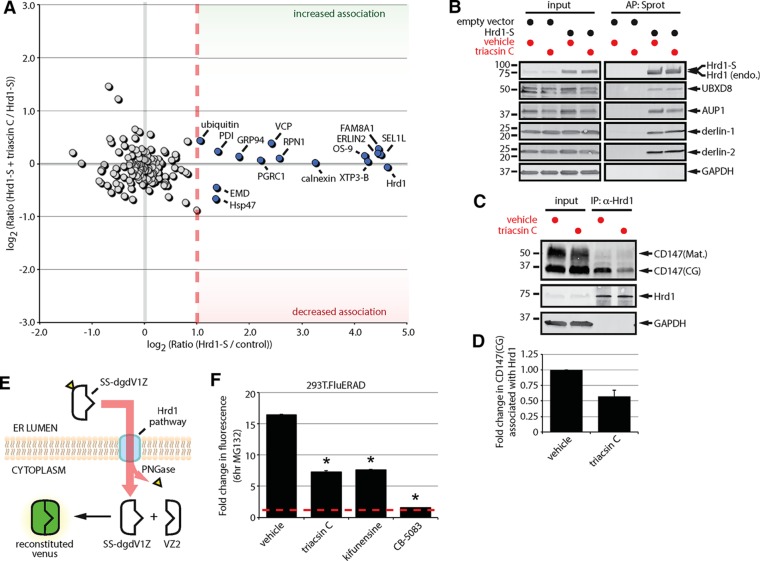
FIGURE 4:
Triacsin C impairs substrate delivery to and dislocation from the Hrd1 complex. (A) Two-dimensional plot representing the proteomic analysis of Hrd1-S interactors from a triple SILAC experiment. The ratio of Hrd1-S/control on the x-axis indicates the strength of the interaction under basal conditions. The ratio of Hrd1-S + triacsin C/Hrd1-S on the y-axis indicates the change in the interaction in response to triacsin C treatment. Gray filled circles are nonspecific interactors, and blue filled circles are high-confidence interactors. (B) HEK293 cells expressing an empty vector or S-tagged Hrd1 were pretreated with vehicle or 1 μg/ml triacsin C for 16 h. Affinity-purified complexes were analyzed by immunoblotting with the indicated antibodies. (C) HEK293 cells were pretreated with vehicle or 1 μg/ml triacsin C for 16 h. Endogenous Hrd1 complexes were immunoprecipitated and analyzed by immunoblotting with the indicated antibodies. (D) The fold change in Hrd1-associated CD147(CG) in C was quantified and is presented as a bar graph (n = 3). (E) The split-Venus dislocation assay. See text for description. (F) 293T.FluERAD cells, which stably express the deglycosylation-dependent Venus dislocation system, were pretreated with 1 µg/ml triacsin C for 16 h, followed by a 0- or 6-h treatment with 10 µM MG-132. Where indicated, 5 µg/ml kifunensine or 5 µM CB-5083 was added together with 10 µM MG-132 for 0 or 6 h. Venus fluorescence levels were quantified by flow cytometry and are represented as the fold change relative to the 0 h. Asterisk indicates a significant decrease in the fold change in fluorescence levels (p < 0.05). AP, affinity purification; CG, core glycosylated; endo., endogenous; IP, immunoprecipitation; Mat., mature; Sprot, S-protein agarose. Error bars indicate SEM.

