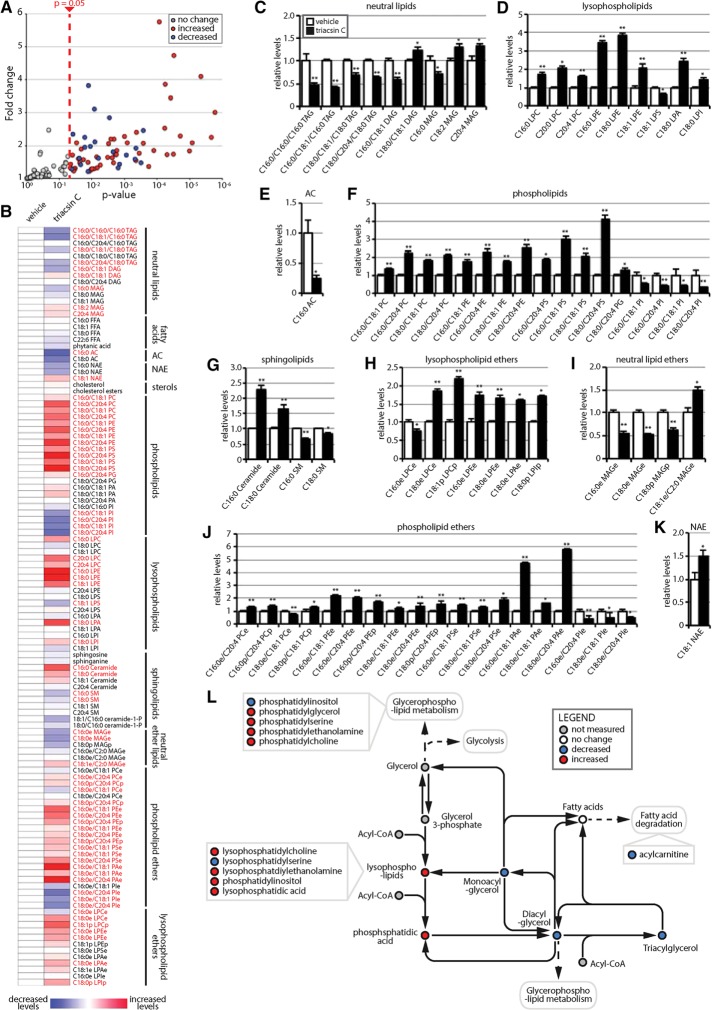
FIGURE 6:
Triacsin C alters the cellular lipid landscape. Targeted metabolomic analysis of the nonpolar metabolome of cells treated with 1 µg/ml triacsin C for 16 h revealed alterations in 71 lipid species, illustrated as a volcano plot (A) and a heat map organized by lipid class (B). Red text in B indicates a significant change (p < 0.05). (C–K) Quantification showing the relative levels of significantly altered lipids (n = 4 or 5). *p < 0.05, **p < 0.01. White bars, vehicle; black bars, triacsin C. (L) Pathway map depicting the general effects of triacsin C on neutral lipids and phospholipids. DAG, diacylglycerol; FFA, free fatty acid; MAG, monoacylglycerol; NAE, N-acylethanolamine; PA, phosphatidic acid; PC, phosphatidylcholine; PE phosphatidylethanolamine; PG, phosphatidylglycerol; PI, phosphatidylinositol; PS, phosphatidylserine; TAG, triacylglycerol. “L” before a lipid phospholipid designation indicates lyso-; “e” after a lipid designation indicates an ether lipid; “p” after a lipid designation designates plasmalogen. Error bars indicate SEM.

