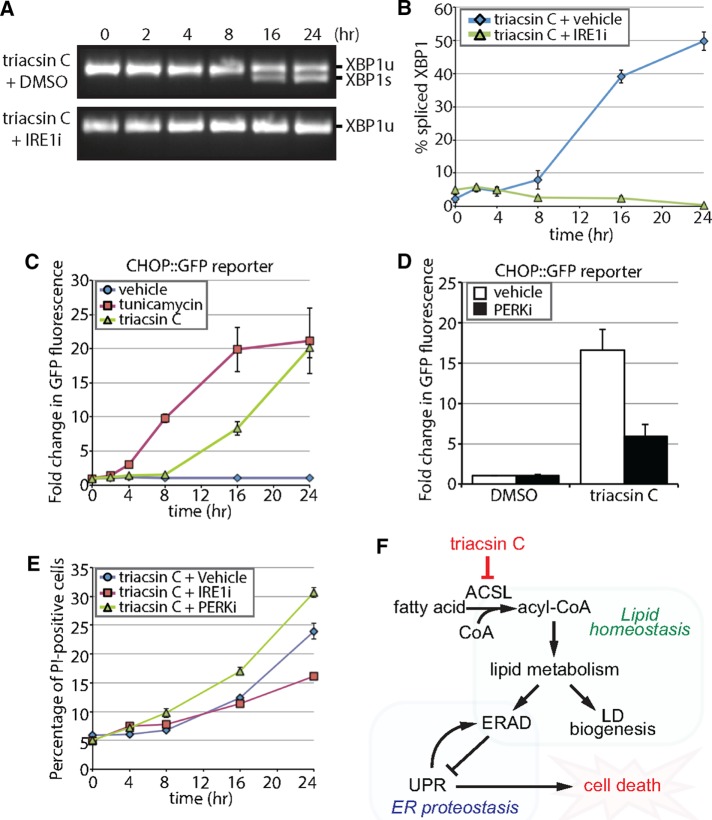
FIGURE 7:
Triacsin C activates opposing arms of the UPR. (A) Reverse transcription PCR assay of XBP1 mRNA from HEK293 cells treated with 1 μg/ml triacsin C for the indicated times in the presence and absence of 100 µM IRE1 inhibitor 4μ8c (IRE1i). XBP1 amplicons were separated on an agarose gel and imaged. XBP1u, unspliced XBP1; XBP1s, spliced XBP1. (B) Quantification of the percentage of spliced XBP1 in A (n = 3). (C) HEK293 cells stably expressing a CHOP::GFP construct were treated with vehicle, 1 µg/ml triacsin C, or 5 µg/ml tunicamycin as indicated and GFP levels measured using flow cytometry. The fold change in GFP fluorescence relative to time 0 h is shown (n = 3). (D) HEK293 cells stably expressing a CHOP::GFP construct were treated with vehicle or 1 µg/ml triacsin C for 0 and 16 h in the presence and absence of 1 µM PERK inhibitor GSK2606414 (PERKi). GFP levels were measured using flow cytometry. The fold change in GFP fluorescence relative to time 0 h is shown (n = 3). (E) HEK293 cells were treated with 1 µg/ml triacsin C and vehicle, 100 µM IRE1i, or 1 µM PERKi for the indicated times and stained with propidium iodide to identify apoptotic cells. The percentage of apoptotic cells relative to time 0 h is shown (n = 3). (F) A model depicting the relationship between fatty acid metabolism and ER proteostasis. Disruptions in fatty acid metabolism result in lipid disequilibrium, causing impairments in ER quality control by inhibiting specific steps in ERAD (independent of LDs). The disruption in ER homeostasis activates the UPR, which protects cells via the PERK pathway and eventually kills cells via the IRE1 pathway. Error bars indicate SEM.

