FIGURE 2:
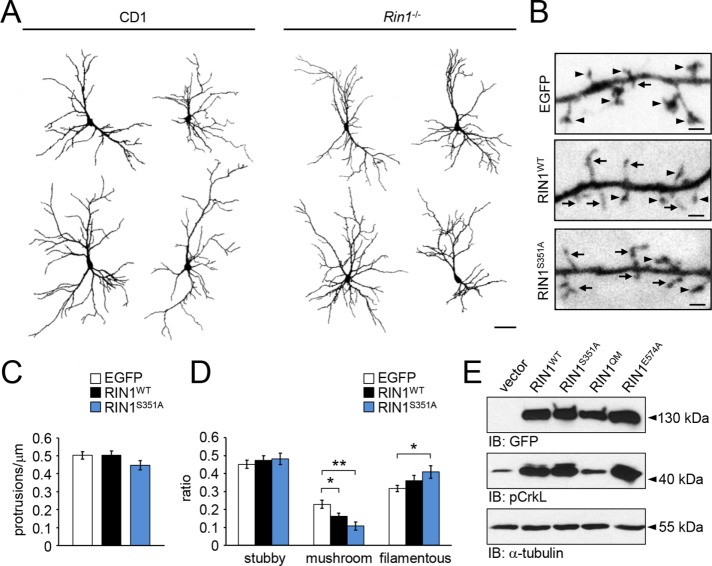
(A) Representative dendritic outlines of EGFP-expressing CD1 and Rin1−/− hippocampal neurons on DIV13. (B) Dendritic branches of Rin1−/− hippocampal neurons expressing EGFP, RIN1WT-EGFP, or RIN1S351A-EGFP for 24 h. (C) Average protrusion density and (D) ratio of stubby, mushroom-like or filamentous spines within the transfected hippocampal neurons. (E) pCrkL levels in HEK293T cells transfected with EGFP-tagged wild-type RIN1, RIN1S351A, RIN1QM, or RIN1E574A constructs. Anti-GFP signal indicates similar expression levels of RIN1 constructs. α-Tubulin served as a loading control. Data are presented as mean ± SEM. *p < 0.05; **p < 0.01. Asterisk represents significant differences compared with control values. Arrows indicate filamentous protrusions; arrowheads show mushroom-type dendritic spines. Scale bar, 50 μm (A), 1 μm (B).

