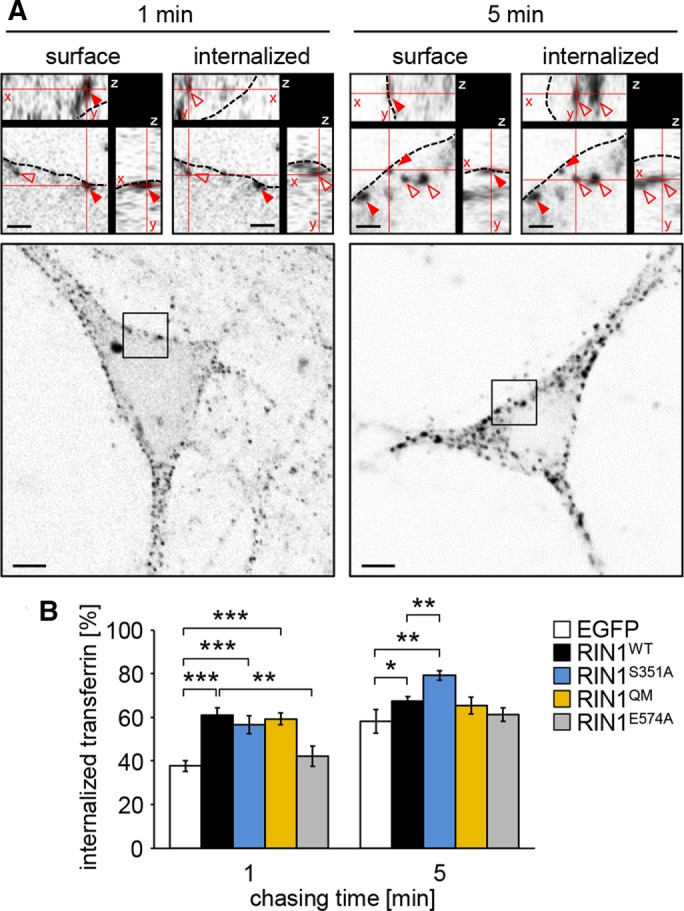
FIGURE 4:

Transferrin uptake in pulse-labeled Rin1−/− hippocampal neurons. (A) Fluorescently labeled transferrin signals associated with the plasma membrane (surface) or internalized after 1 or 5 min of chasing time. Red arrowheads show surface-localized transferrin puncta; empty arrowheads indicate internalized transferrin signals; dashed line indicates plasma membrane. The xyz-planes are represented in cut-view images (top). Scale bars, 1 μm (cut views), 5 μm (overviews). (B) The ratio of internalized transferrin signals compared with the total number of transferrin-positive puncta visible in the equatorial plane of the neuronal soma in Rin1−/− neurons transfected with the indicated fluorescently tagged constructs. Data are presented as mean ± SEM. *p < 0.05; **p < 0.01; ***p < 0.001.
