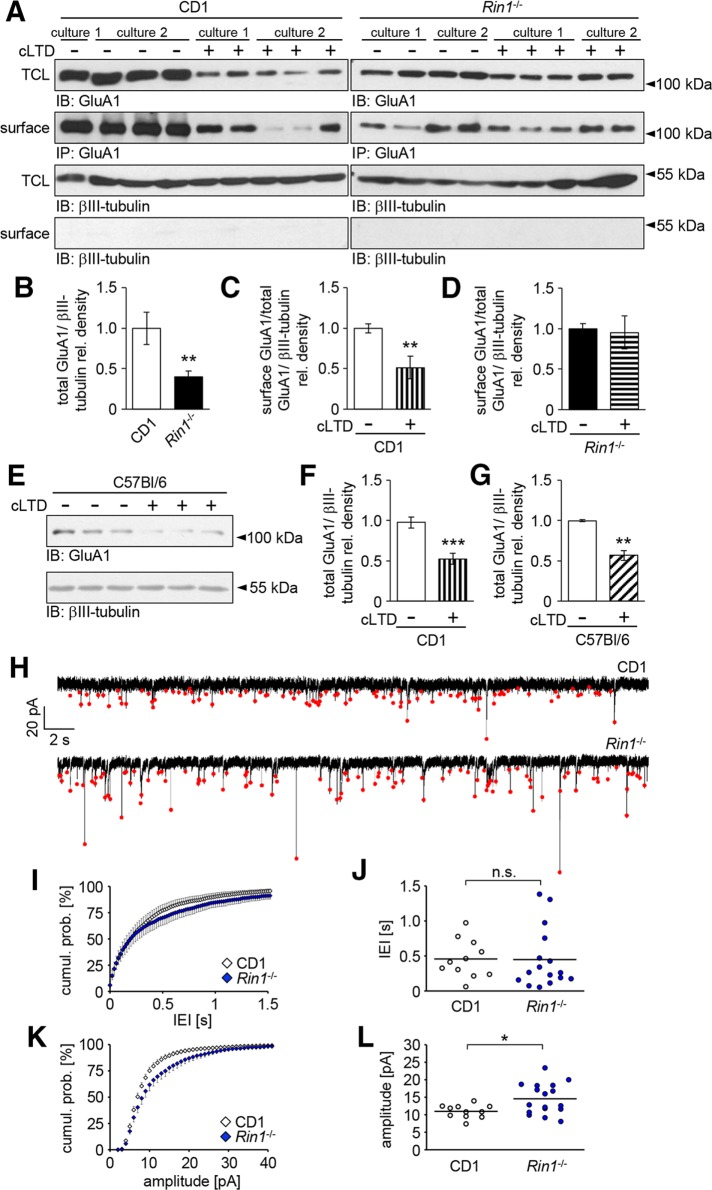
FIGURE 5:
Analysis of AMPA receptor expression and activity at the cell surface. (A–D) Surface biotinylation of GluA1 subunits in CD1 and Rin1−/− hippocampal neuronal cultures. (A) Representative Western blots of TCLs and biotinylated samples precipitated on NeutrAvidin beads (surface) under control conditions or 2 h after cLTD treatment. βIII-tubulin served as a loading control and was absent from the precipitated samples. TCL lysates and βIII-tubulin blots from CD1 and Rin1−/− cultures were developed under the same conditions. In the case of biotinylated GluA1 subunits, exposure time for the CD1 samples was longer than in the case of the Rin1−/− samples. (B) Comparison of the relative GluA1 levels in TCLs from Rin1−/− or CD1 cultures. (C, D) Changes in the relative surface-labeled GluA1 levels after cLTD treatment in CD1 (C) or Rin1−/− (D) cultures. (E) Representative Western blot images of total GluA1 levels in C57Bl/6 neuronal cultures after cLTD induction. (F, G) Comparison of cLTD-evoked decrease in the total GluA1 level between CD1 (F) and C57Bl/6 (G) neuronal cultures. (H) Representative whole-cell patch clamp recordings obtained from CD1 or Rin1−/− neurons. The mEPSCs are indicated by red dots. (I, K) Pooled cumulative probability density distributions of mEPSC interevent intervals (IEIs) and mEPSC amplitudes, respectively. (J, L) Scatter plots showing the medians of IEIs and mEPSC amplitudes, respectively. Median mEPSC amplitude in Rin1−/− cultures is significantly higher than in CD1 cultures. Data are presented as mean ± SEM. *p < 0.05; **p < 0.01; ***p < 0.001.

