FIGURE 6:

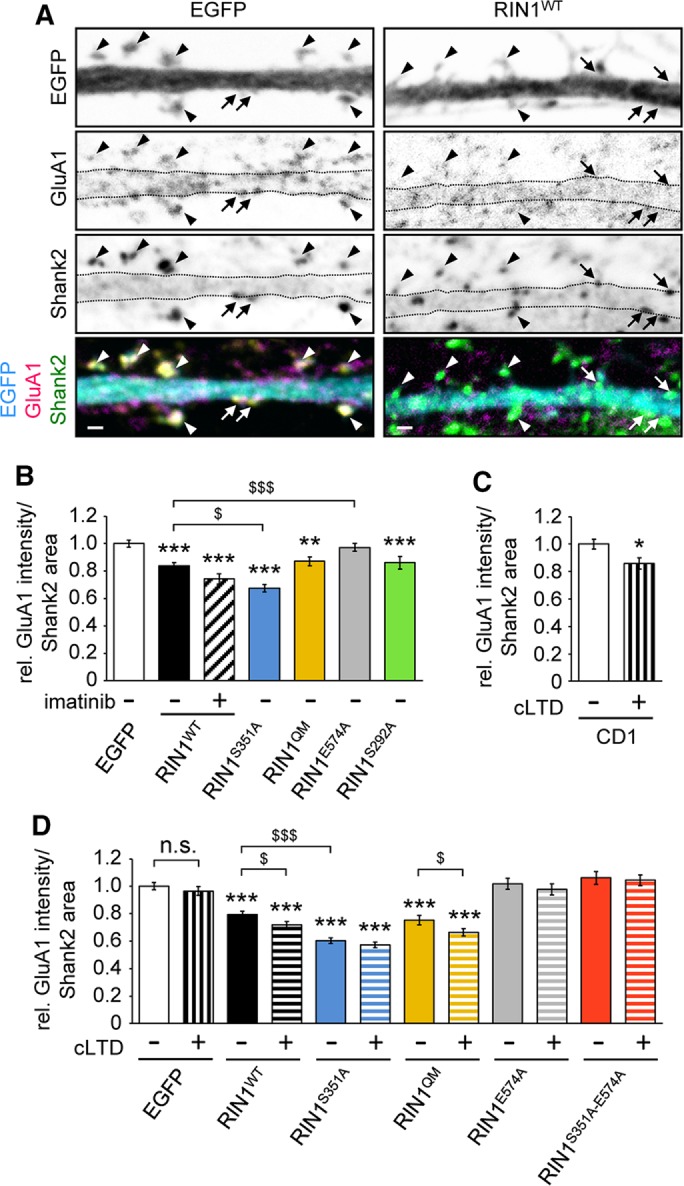
Anti-GluA1 antibody feeding in hippocampal neuronal cultures. Relative anti-GluA1 signal intensity was determined within Shank2-positive postsynaptic densities (PSDs) at the plasma membrane. (A) Representative pictures of Rin1−/− dendrites transfected with EGFP or EGFP-tagged RIN1WT after 10 min of antibody feeding with anti-GluA1. PSD was delineated based on clear Shank2 positivity. Arrows point at shaft synapses; arrowheads indicate spines. Scale bar, 1 μm. (B–D) Quantification of GluA1 signal intensities within Shank2-positive PSD areas in EGFP-transfected neurons of CD1 cultures (C) or in Rin1−/− neurons transfected with the indicated EGFP-tagged constructs (B, D). cLTD was evoked by 3 min of 50 μM NMDA treatment, and neurons were analyzed 2 h later (C, D). Imatinib was applied at 5 μM for 1 h (B). Data are presented as mean ± SEM. *,$p < 0.05; **p < 0.01; ***,$$$p < 0.001. Asterisk indicates difference compared with the EGFP values.
