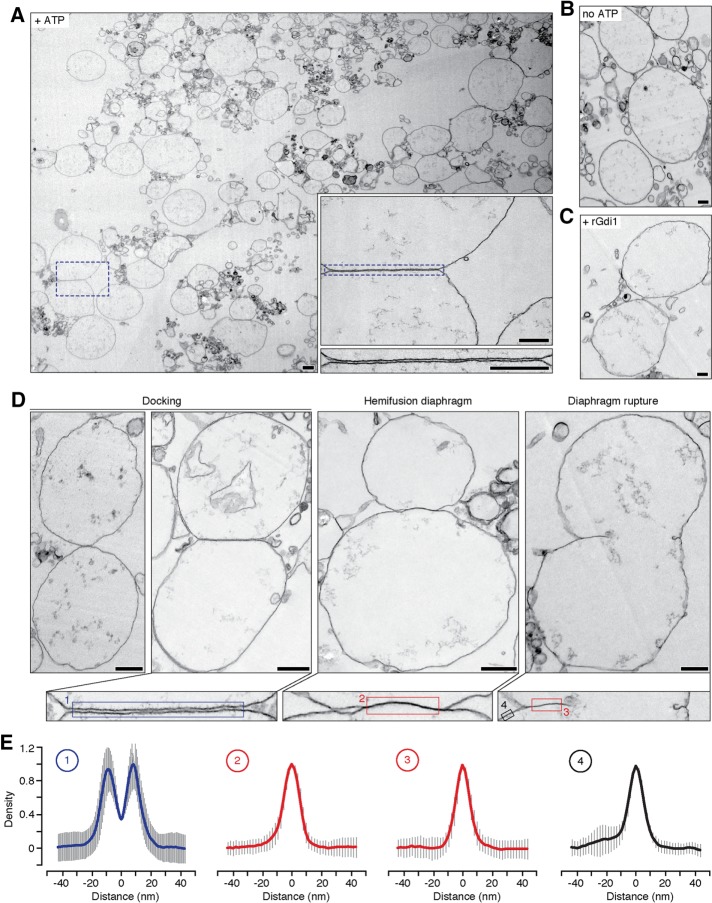
FIGURE 4:
Vacuole membrane docking and hemifusion visualized by transmission electron microscopy. (A) Transmission electron micrograph of a vacuole fusion reaction under control conditions (+ATP) at 30 min. Boxes are higher-magnification images illustrating a docking site between apposing organelles. Scale bars, 200 nm. Images of vacuoles incubated without ATP (B) or with ATP and recombinant Gdi1 protein, a Rab-GTPase inhibitor (14 µm; C) are shown as negative controls. Scale bars, 200 nm. (D) Top, transmission electron micrographs of docked vacuole membranes, a hemifusion diaphragm, and ruptured diaphragm. Bottom, higher-magnification images of membrane interfaces. Scale bars, 500 nm. (E) Averages of linear density plots within the areas shown in D (n = 10–88; error bars represent SD). Scale bars, 50 nm.

