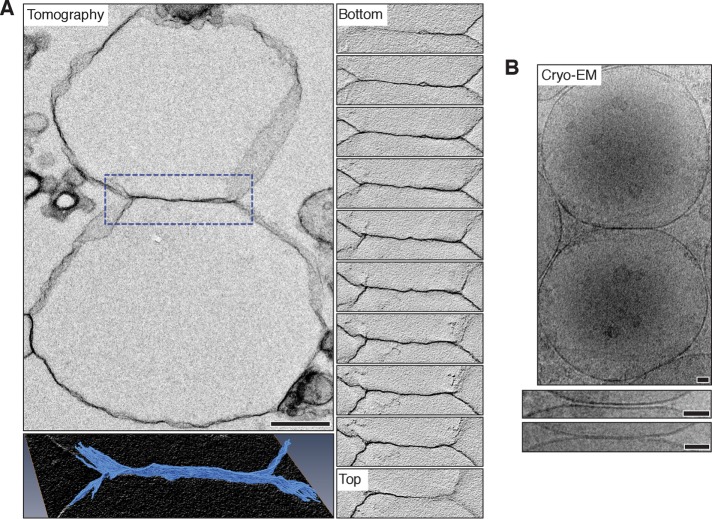
FIGURE 5:
Vacuole membrane hemifusion confirmed by electron tomography and cryo–electron microscopy. (A) Top left, vacuole hemifusion diaphragm obtained using electron tomography. Serial sections of the boxed area containing the interface are shown (right; Supplemental Video S3). Scale bar, 500 nm. Bottom left, three-dimensional reconstruction of the interface at higher magnification. Supplemental Video S4 illustrates the reconstruction. (B) Top, cryo–electron micrograph of an in vitro vacuole fusion reaction. Examples of docked vacuole membranes (middle) and a hemifusion diaphragm (bottom) are shown at high magnification. Scale bars, 50 nm.

