FIGURE 6:
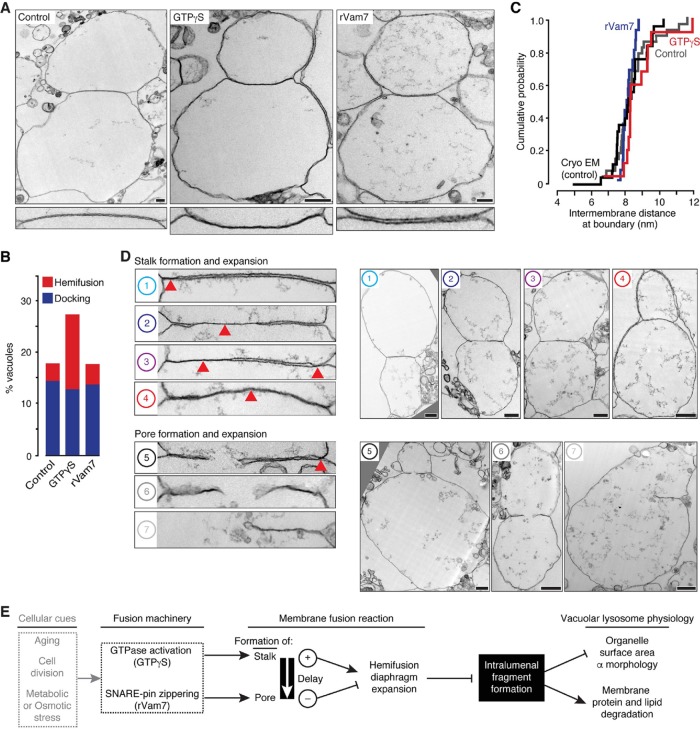
Characterization of hemifusion intermediates that underlie fragment formation and their potential contribution to cellular physiology. (A) Top, transmission electron micrographs of vacuole fusion reactions in the absence and presence of 0.2 mM GTPγS obtained at 30 min or 100 nM rVam7 at 10 min. Bottom, interfaces at higher magnification. Scale bars, 250 nm. Electron micrographs were used to calculate (B) percentages of vacuoles engaged in docking or hemifusion (n ≥ 200) or (C) intermembrane distances at docked interfaces (n ≥ 13). (D) Transmission electron micrographs showing examples of different hemifusion intermediates observed in vacuole fusion reactions containing 0.2 mM GTPγS. Left, higher-resolution images of interfaces between adjacent vacuoles shown on the right. Numbers correspond to intermediates of the vacuole membrane fusion reaction illustrated in Figure 1A. Red arrowheads indicate hemifusion diaphragms. Scale bars, 500 nm. (E) Model describing how intralumenal fragment formation is regulated and may contribute to changes in lysosomal vacuole physiology in response to cellular cues.

