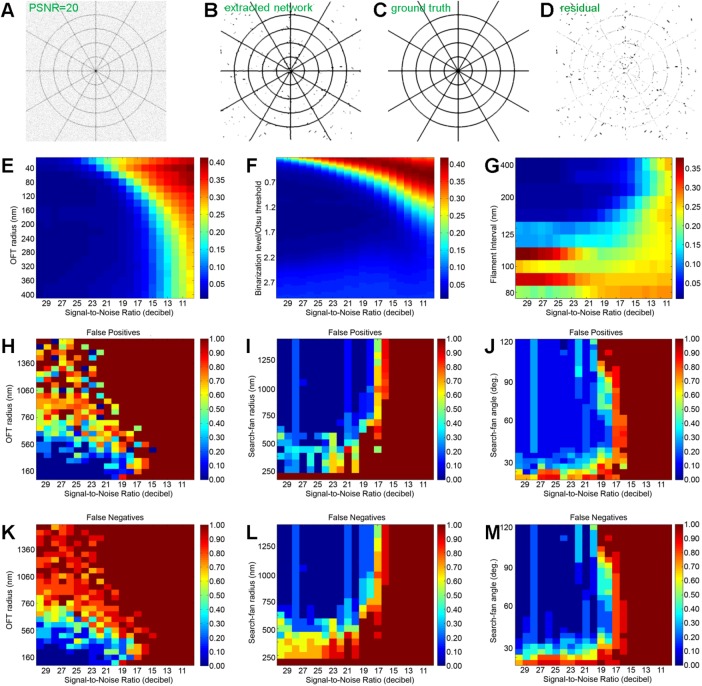
FIGURE 4:
Sensitivity analysis. (A–D) Flow chart illustrating the calculation of extraction error. (A) Synthetic cobweb image with PSNR = 20 dB. (B) Detected skeleton of the network in A convoluted with a 50-nm-width Gaussian function. (C) Ground-truth image. (D) Residual computed by subtracting C from B. The extraction error (image difference) is calculated as the mean pixel value of D. (E, F) Cobweb: extraction error calculated as a function of image noise (PSNR) vs. (E) OFT r parameter and (F) binarization threshold, defined relative to the Otsu’s formula. (G) Parallel lines: extraction error (image difference) calculated as a function of image noise (PSNR) vs. line density. (H–M) Maps of false positives (H, I) and false negatives (K–M) for the accuracy of individual filament detection (defined in the text) as a function of image noise (PSNR) vs. (H, K) OFT r parameter, (I, L) search-fan radius, and (J, M) search-fan angle.

