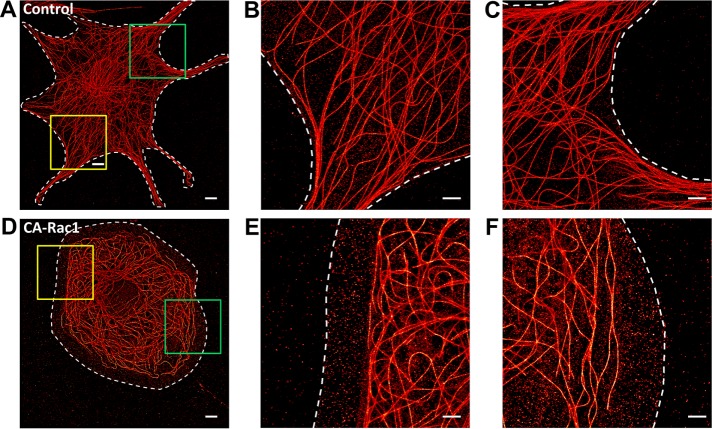
FIGURE 5:
Microtubule network architecture is regulated by small GTPase Rac1. Superresolution SMLM images of MT networks in NIH 3T3 fibroblasts. (A–C) control and (D–F) CA Rac1 overexpression. Magnified views of (B, C) yellow and (E, F) green boxed regions in A and D. White dashed lines denote cell boundaries. Scale bars, 5 μm (A, D), 2 μm (B, C, E, F).

