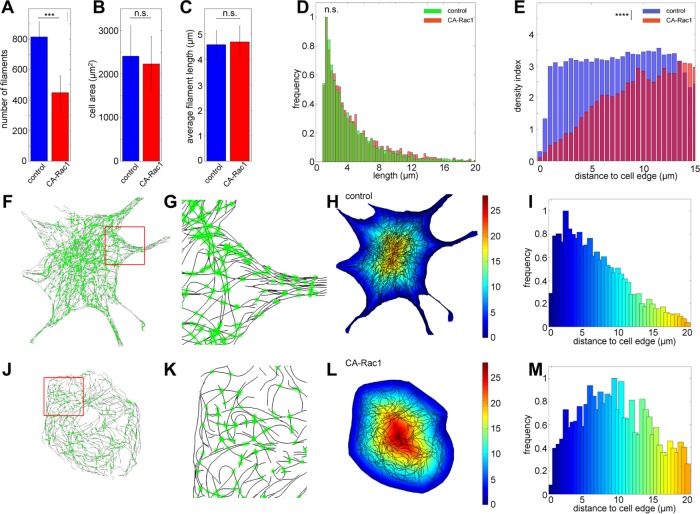
FIGURE 6:
Quantitative analysis of MT network architecture phenotypes downstream of Rac1. Comparison of the numbers of filaments per cells (A), cell area (B), and average filament length (C) between control (blue) and CA-Rac1 condition (red; ncontrol, 7; nCA-Rac1, 5; error bar, SD, n.s., not significant; ***p < 5 × 10⁻⁴, Student’s t test). (D) Histograms of normalized filament length distribution (green, control; red, CA-Rac1). n.s., not significant; p = 0.08, Kolmogorov–Smirnov test. (E) Distribution of MT density index as a function of distance from cell edges (blue, control; red, CA-Rac1). ****p < 5 × 10⁻⁵, Kolmogorov–Smirnov test. (F, J) Overlay of filament intersection sites (green) on SMLM images of control (F) and CA Rac1–expressing cells (J). (G, K) Magnified views of boxed regions (red) in F and J. (H, L) Overlay of MT centerlines (black) on a color code map indicating distance from the cell edge. Color bar: micrometers from cell edge. (I, M) Normalized distributions of junction density as a function of distance from cell edges for (I) control and (M) CA Rac1–expressing cells, using the same color scale as in H–L.

