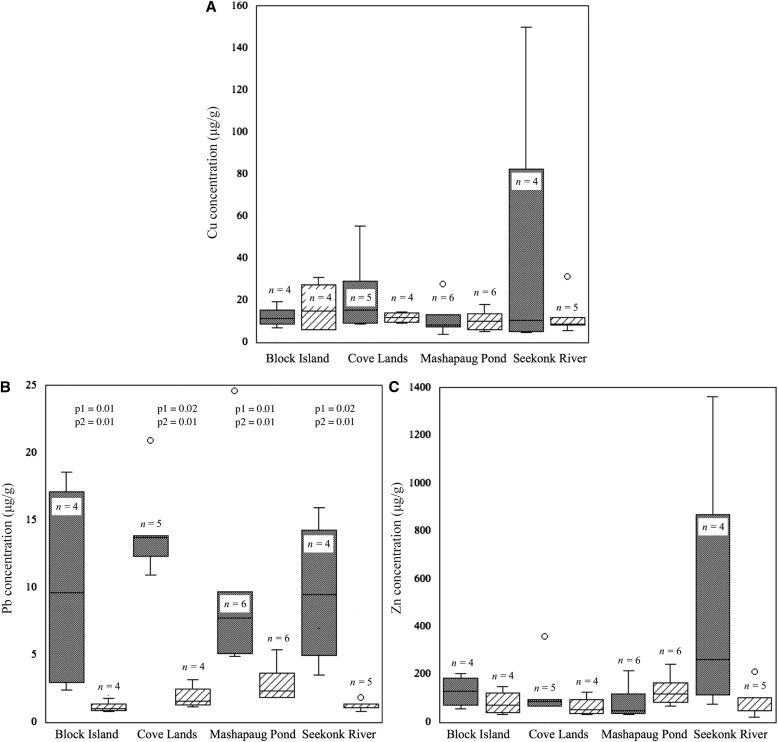
Fig. 2.
Heavy metal concentrations (μg/g) of all species combined at each site. Historical specimens are shown with dotted fill; 2015 specimens are shown with diagonal lines. Box plots indicate first and third quartile and median values. Whiskers show range, except for outliers, which are shown as circles. Significant differences are indicated by P values based on Wilcoxon (p1) and Kruskal–Wallis rank sums tests (p2). Raw data can be found in Appendix 3. Duplicates were included as a single value (the average of the two measurements), and historical specimens treated with mercuric chloride insecticide were excluded.

