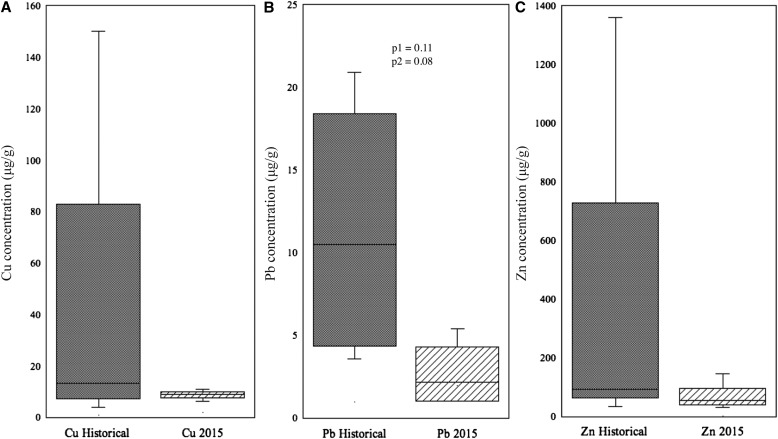
Fig. 4.
Concentration (μg/g) of Cu (A), Pb, (B), and Zn (C) of Plantago specimens from the historical and 2015 time periods. Samples from all sites were pooled for each time period (n = 4 for each site at each time period). Marginally significant differences in Pb concentrations are indicated by P values based on Wilcoxon (p1) and Kruskal–Wallis rank sums tests (p2).

