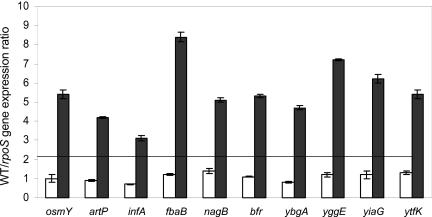
FIG. 1.
Real-time PCR experiments. Values are shown as induction factors for expression in the wild-type (WT) strain MG1655 versus the rpoS mutant strain EB1.3 in the exponential (white bars) and stationary (black bars) phases of growth. The genes tested are indicated in the figure. Values were normalized to those for the 16S rRNA gene, and results shown are averages of three experiments. The horizontal line shows the 2.5-fold threshold used to select rpoS-dependent genes in the microarray experiments.

