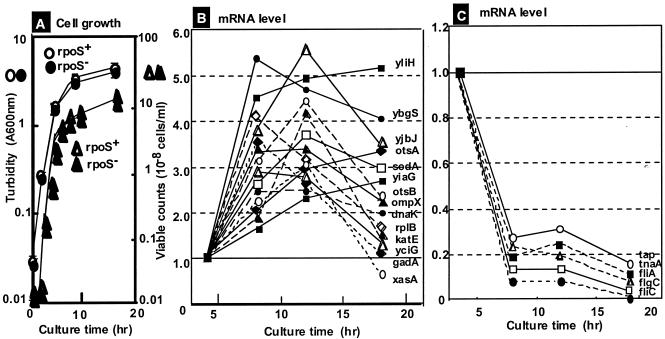
FIG. 1.
Growth phase-coupled variation of mRNA levels. (A) E. coli W3110 was grown in LB. Cell growth was monitored by measuring the turbidity at 600 nm, and the number of viable cells was determined by measuring colonies on LB agar plates. (B and C) Microarray assays were carried out as described in Materials and Methods, first for mixtures of Cy3-labeled cDNAs for exponential-phase RNAs and Cy5-labeled cDNAs for stationary-phase RNAs and second with the opposite combination. The assays were repeated twice with independent cultures. The level of each mRNA at each point during the stationary phase, relative to the exponential-phase level, was calculated. For the mRNAs whose levels increased (B) or decreased (C) in the stationary phase, the culture time-dependent variation is shown for some representative species (for details see Tables 1 and 3).

