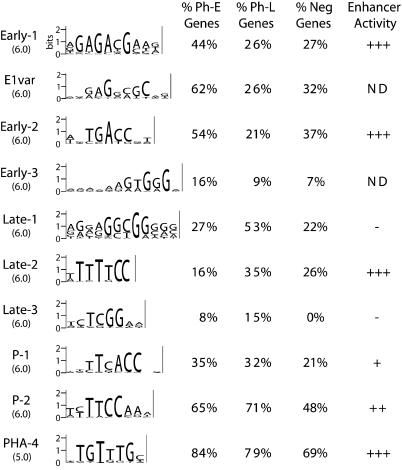
Figure 3. Candidate Pharyngeal Motifs Identified by Improbizer.
Improbizer represents motifs as PWMs; the PWMs for the motifs are shown in Dataset S1. We converted these matrices to the “sequence logos” shown here (Schneider and Stephens 1990; Crooks et al. 2004). The threshold scores used by Cluster-Buster (Frith et al. 2003) for each motif are shown below the sequence logos. “% Ph-E Genes” and “% Ph-L Genes” are the percentage of Ph-E and Ph-L genes that contain occurrences of a given motif within 500 bp upstream of the predicted ATG start codon, above the threshold shown. “% Neg Genes” is the percentage of DNA synthesis genes that contain occurrences of a given motif (above the threshold score) within 500 bp upstream of the predicted ATG start codon. Two other negative groups (carbohydrate synthesis genes [Kim et al. 2001] and a set of 194 randomly selected genes) yielded similar results (data not shown). “Enhancer Activity” is the relative strength of expression generated by a motif present in three copies upstream of the Δpes-10::GFP::HIS2B reporter. ND, not determined.

