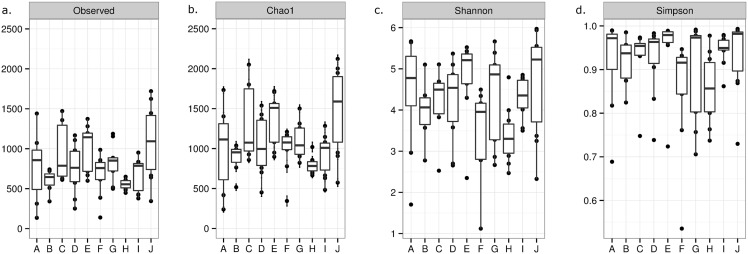
Fig 2. Diversity measurements of the bacterial communities of houseflies sampled across location.
Boxplot displaying the observed number of OTUs (a), richness (b; Chao1), evenness (c; Shannon’s index) and biodiversity (d; Simpson’s index) per location (A-J) of sampling (n = 7–10). The boxplot bounds the interquartile range (IQR) divided by the median, the whiskers extend to 1.5x IQR beyond the box.

