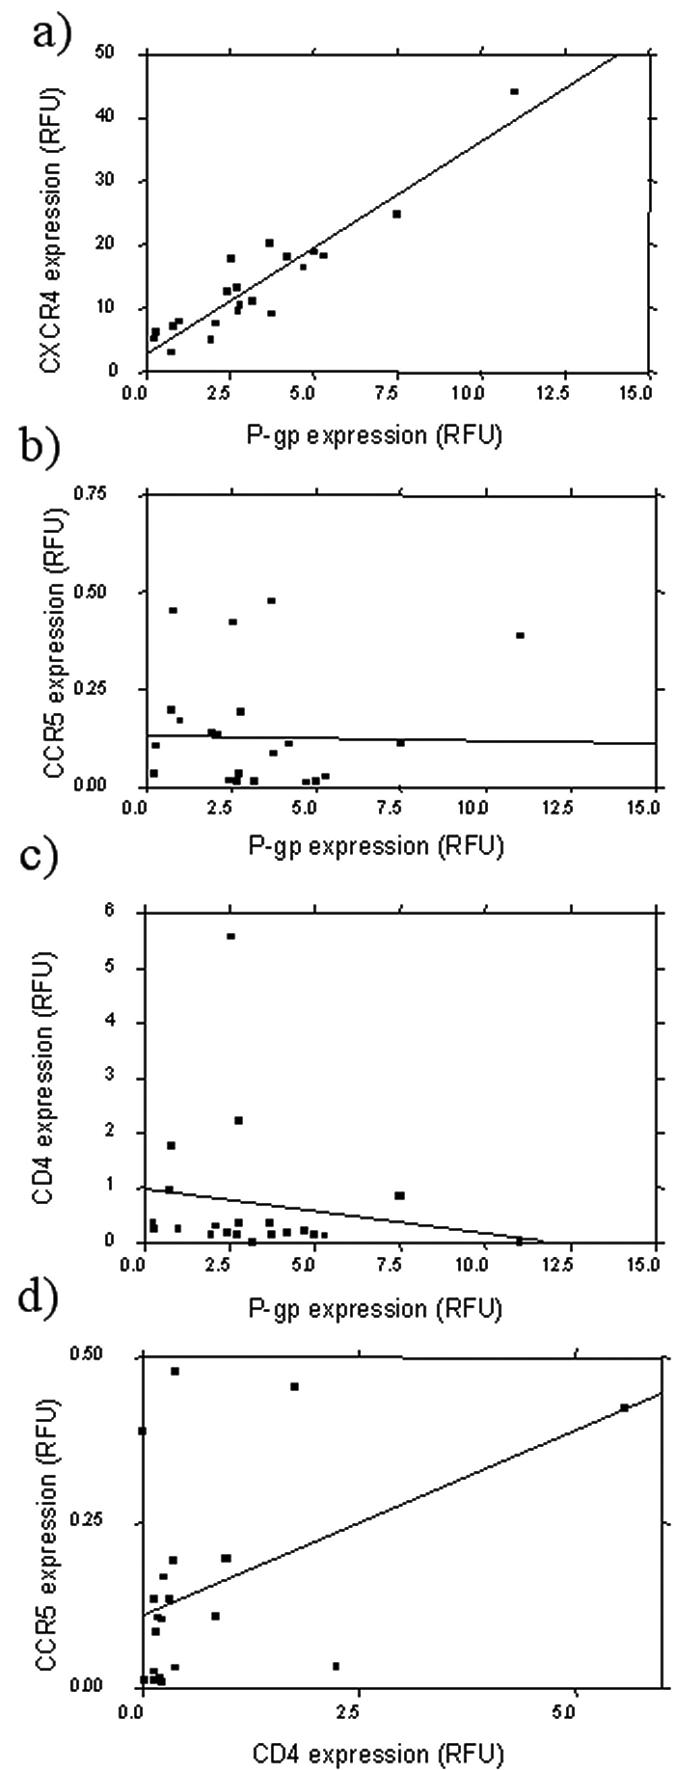
FIG. 1.

Relationship between P-gp expression and expression of (a) CXCR4, (b) CCR5, and (c) CD4 in PBMC isolated from healthy volunteers. (d) Relationship between CCR5 and CD4 in PBMC isolated from healthy volunteers. Proteins were quantified by flow cytometry, and levels are expressed in relative fluorescence units. Statistical analysis was carried out by Spearman's rank correlation. A statistically significant positive correlation was observed between P-gp and CXCR4 (n = 21; rho = 0.87; P < 0.001) and between CCR5 and CD4 (n = 21; rho = 0.47; P < 0.05). A significant inverse correlation was observed between P-gp and CD4 (n = 21; rho = −0.44; P < 0.05).
