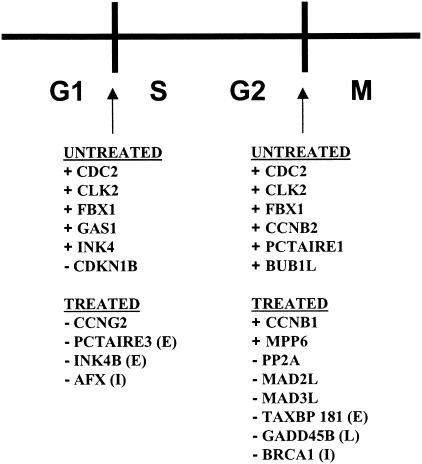
FIG. 4.
Impact of HIV-1 infection on cell cycle genes in MDM. Schematic of the cell cycle, with G1, S, G2, and M indicated. Genes expressed differentially by cluster analysis or mutually exclusive analysis in mock- or virus-treated MDM cultures are listed below the G1/S and G2/M checkpoints. Genes marked + promote progression through cell cycle checkpoints. Genes marked − inhibit progression through cell cycle checkpoints. Time points at which genes were detected are indicated in parentheses: early (E), intermediate (I), and late (L).

