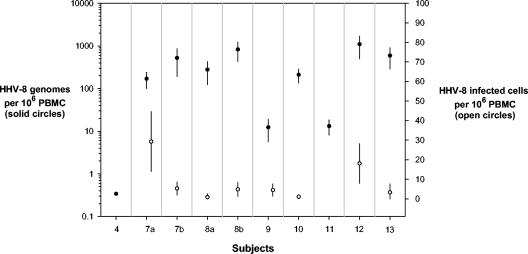
FIG. 2.
Frequency of HHV-8 genome and frequency of infected cells in PCR-positive subjects with or at risk for KS. Error bars represent 95% confidence intervals (for some points, the confidence intervals are smaller than the plotted symbol). The measured frequencies were based on testing 12 replicates in each of five serial dilutions (22 replicas for subject 4), among which three to four dilutions showed percentages of negative wells between 0 and 100% and therefore were suitable for Poisson analysis. For subject 10, calculations for infected cell frequency are based only on the two informative dilutions. For the three subjects with the lowest frequency of infected cells (patients 8a and 13) and genomes (patient 4), only the lowest dilution was positive.

