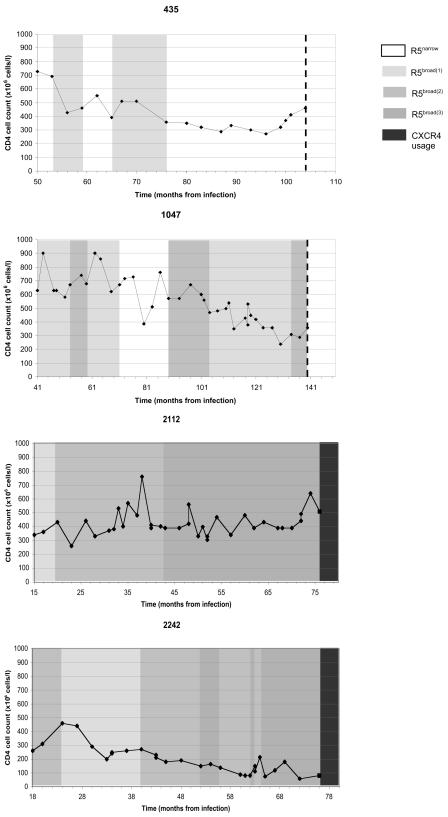
FIG. 3.
CD4+-T-cell counts and use of chimeric receptors of R5 viruses for four patients. Patients 435 and 1047 are nonswitch virus patients and yielded virus with the R5 phenotype throughout the study (10 and 14 isolates tested, respectively). The dashed line denotes the end of the study. Patients 2112 and 2242 are switch virus patients who later acquired CXCR4-using virus. Each virus was tested twice. The left axis and line show the CD4+-T-cell counts as numbers of cells (106) per liter of blood. The four different shades of grey and white display changes in viral phenotypes over time, with white indicating the R5narrow phenotype; increasing darkness indicating the R5broad(1), R5broad(2), and R5broad(3) phenotypes; and the darkest grey indicating CXCR4-using virus. The infection date was calculated as the midpoint between the last negative and the first positive sample.

