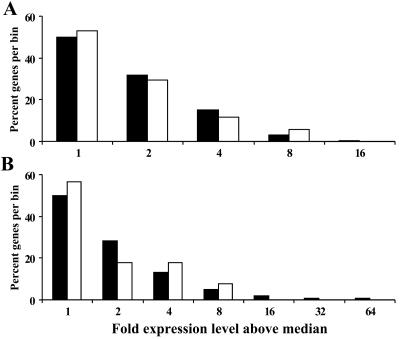
FIG. 4.
Relationship between transcriptional activity of target genes and frequency of ASV integration events. Expression levels of total genes and target genes were collected in bins based on their fold value above the median. Fold values above the median are indicated as 2 (one through twofold), 4 (two- through fourfold), etc., for each bin. Percentages of total genes (filled bars) or target genes (open bars) in each bin are plotted. Target site values on the x axis are truncated, eliminating higher irrelevant values for which no integrations were observed. (A) Analysis applied to the GEO GSM2145 data set. (B) Analysis applied to the H56 data set. Using Spearman's test, we determined a rank correlation between total genes and target genes (for panel A, P = 0.0083, R = 1.0; for panel B, P = 0.05, R = 0.9; R = Spearman's correlation).

