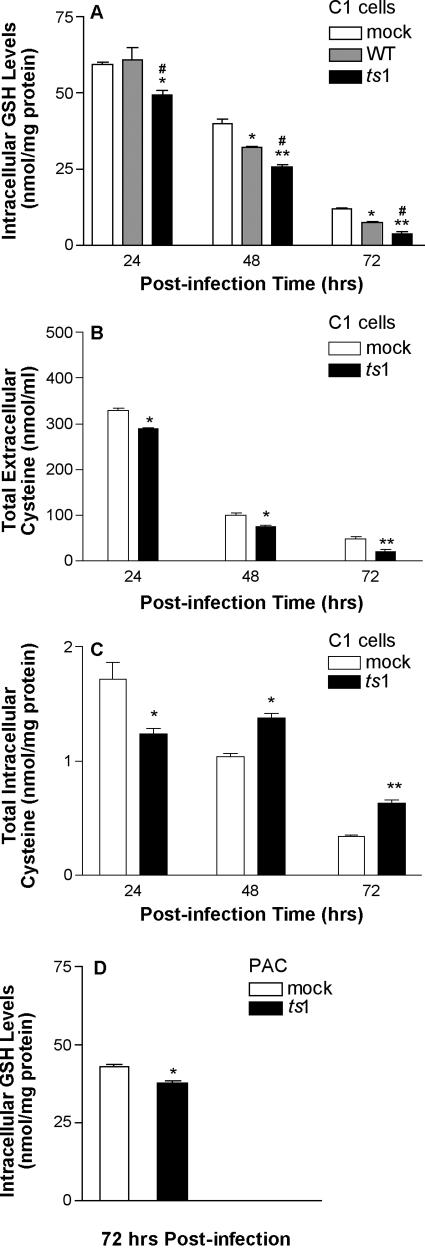
FIG. 1.
Intracellular GSH content and intracellular and extracellular cysteine levels in ts1-infected astrocytes. (A) C1 astrocytes were plated at 2 × 10⁶ cells per 100-mm dish, and then either mock-, WT-, or ts1-infected at an MOI of 5 for 40 min. After incubation for 24, 48, and 72 hpi, intracellular GSH measurements were performed with a GSH assay kit. Intracellular GSH levels are expressed as the numberof nanomoles per milligram of cellular protein. (B and C) After mock or ts1 infection, C1 cells were cultured for 24, 48, and 72 hpi, at which time cystine/cysteine levels were measured from the culture medium (B) or from the cells (C) by a fluorometric HPLC method. (D) PACs were plated at 106 cells per 100-mm dish, and then mock or ts1 infected at an MOI of 5 for 40 min. After incubation for 72 hpi, intracellular GSH was measured. All graphs reflect means ± standard deviation from three to four independent experiments. *, P < 0.05 compared to mock infection at 24, 48, and 72 hpi; **, P < 0.01; #, P < 0.05, compared to WT infection at the same time points.

