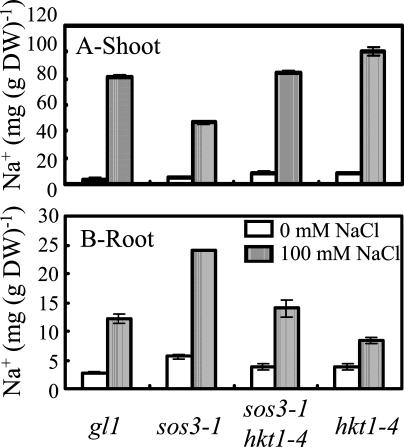
Figure 4.
hkt1-4 restores Na+ content of sos3-1 plants to a level similar to that of wild-type plants (gl1). Plants were grown as described in Figure 3. Plants were harvested 5 weeks after the start of NaCl treatment. Shoots and roots (n ≥ 7 for each genotype per treatment) were separated, and materials were rinsed with deionized water and pooled into independent groups (minimum of approximately 50 mg after drying) for ion content analyses. A, Na+ content in the shoot; values are the mean ± se (n = 3). The fresh weight of the plants not treated with NaCl is gl1, 2.95 ± 0.2 g; sos3-1, 2.37 ± 0.25 g; sos3-1 hkt1-4, 2.32 ± 0.21 g; and hkt1-4, 2.63 ± 0.24 g, and of plants treated with NaCl (100 mm final concentration) is gl1, 2.34 ± 0.16 g; sos3-1, 0.44 ± 0.03 g; sos3-1 hkt1-4, 1.23 ± 0.09 g; and hkt1-4, 1.27 ± 0.04 g. B, Na+ content in the root; values are the mean ± se (n ≥ 2), except for sos3-1 treated with 100 mm NaCl. These data are representative of those obtained in replicate experiments.

