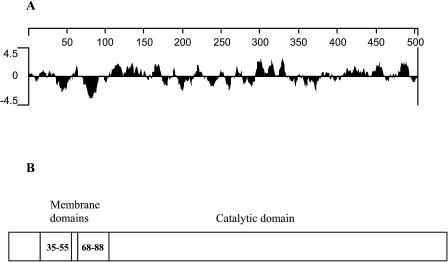
Figure 3.
Hydropathy analysis of nasturtium FAE. A, Hydropathy plot of FAE indicating the presence of several hydrophobic regions. B, Schematic representation of the putative transmembrane domains of nasturtium FAE amino acid sequence as predicted by TMAP analysis. Numbers shown in the boxes correspond to the residues of each domain in the FAE polypeptide.

