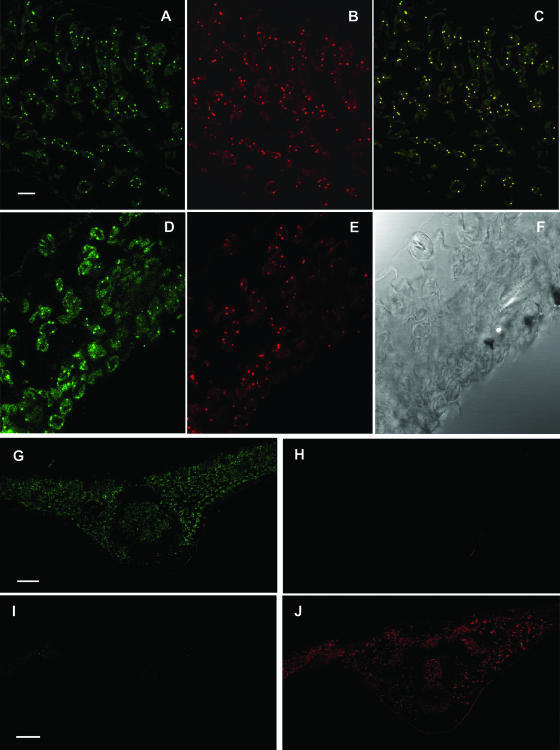
Figure 6.
Colocalization of NOS and catalase in pea leaves. Representative images illustrating the CLSM detection of NOS and catalase in spongy mesophyll and guard cells of pea leaf sections (60 μm thick). A and D, Cy2-streptavidin immunofluorescence punctuates (green) attributable to anti-iNOS. B and E, Cy3 immunofluorescence punctuates (red) attributable to anti-catalase. C, Colocalized immunofluorescence punctuates (yellow). F, Bright-field image of the same pea leaf area. G and H, Images of the same pea leaf section where the catalase antiserum was omitted but not the other components of the colocalization mixture; therefore, only the anti-iNOS fluorescence (green) is observed. I and J, Images of the same pea leaf section where the iNOS antiserum was omitted but not the other components of the colocalization mixture; therefore, only the anti-catalase fluorescence (red) is observed. Scale bar represents 10 μm (A–F) and 20 μm (G–J).

