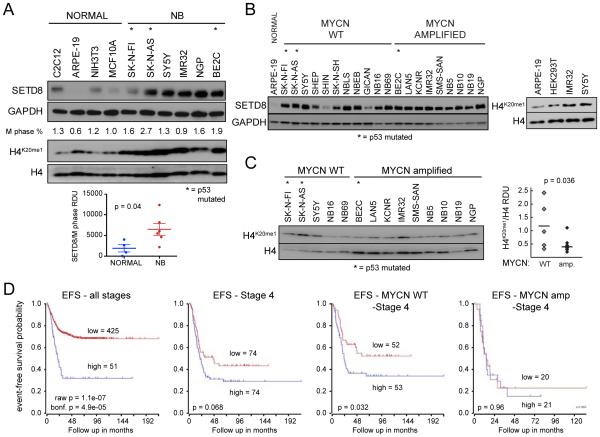
Figure 3. SETD8 is overexpressed in NB cells and high SETD8 expression associated with worse prognosis in MYCN-WT tumors.
(A) Immunoblots show SETD8 and H4K20me1 levels in NB cells compared with control cells. SETD8 protein levels normalized to M phase % in NB compared to normal cells were calculated as RDU (Relative Densitometric Unit, p = 0.04). Bars show the mean ± SEM.
(B) Immunoblot showing SETD8 protein levels in MYCN-WT and MYCN-amp NB cells.
(C) Western blot (left) and densitometric analysis (right) of H4K20me1 protein levels normalized to H4 protein levels in 14 NB cell lines were calculated as RDU (p = 0.036) using Image J Software.
(D) Kaplan-Meier plots based on the expression of SETD8 tumors from NB patients at all stages (left panel) or in tumors from stage 4 (middle left panel) NB patients (R2 database: Kocak raw p = 1.1e-07 bonf p = 4.9e-05; p = 0.068). Kaplan-Meier plots based on the expression of SETD8 in MYCN-WT (middle right panel) or MYCN-amp (right panel) tumors from stage 4 NB patients (R2 database: Kocak n = 105, MYCN-WT, stage 4 NB tumors, p = 0.032; n = 41, MYCN-amp, stage 4 NB tumors, p = 0.96).
See also Figure S3.

