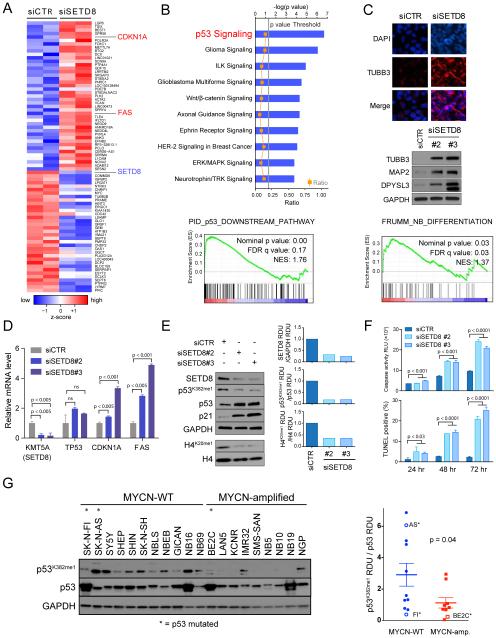
Figure 4. Genetic inhibition of SETD8 leads to activation of the p53 canonical pathway by decreased p53K382me1 levels.
(A) Heatmap showing the top up- and down-regulated genes ranked by statistical significance following 36 hr of SETD8 silencing in SY5Y cells. Data are presented as normalized expression values of 2 biological replicates based on edgeR software analysis and FDR < 0.001. The color key represents the normalized expression values: blue (low) to red (high).
(B) The top ten differentially expressed canonical pathways after SETD8 silencing in SY5Y cells defined by IPA (Ingenuity pathway analysis) based on edgeR software analysis and FDR < 0.001 (upper panel). GSEA (Gene Set Enrichment Analysis) of the p53 downstream pathway (lower panel, nominal p value = 0.00, FDR = 0.17, NES = 1.76) after SETD8 silencing.
(C) Immunofluorescence analysis showing the expression of TUBB3 (red) after SETD8 silencing for 72 hr in SY5Y cells counter-stained with DAPI (blue). Scale bars, 100 μm (upper panel). Immunoblot of proteins from SY5Y cells 72 hr after transfection with control siRNA and SETD8 siRNAs and blotted with antibodies detecting TUBB3, MAP2 and DPYSL3 proteins (middle panel). GSEA of the FRUMM NB differentiation signature (lower panel, nominal p value = 0.03, FDR = 0.03, NES = 1.37) after SETD8 silencing.
(D) qRT-PCR analysis showing relative mRNA levels of the indicated genes after SETD8 silencing for 36 hr. Bars show the mean ± SEM of 3 replicates.
(E) Immunoblot analysis of SY5Y (MYCN-WT) cells upon treatment with either of 2 different siRNAs targeting SETD8 for 72 hr. Densitometric analysis of SETD8 protein levels normalized to GAPDH (upper right panel), of p53K382me1 protein levels normalized to p53 (middle right panel) and of H4K20me1 protein levels normalized to H4 (lower right panel) after SETD8 silencing calculated as RDU using Image J Software.
(F) Caspase 3/7 activity and number of TUNEL positive cells upon SETD8 silencing in SY5Y cells. Bars show the average of 3 replicates ± SD.
(G) Immunoblot (left) and densitometric analysis (right) of p53K382me1 protein levels normalized to p53 protein levels in 20 NB cell lines were calculated as RDU (p = 0.04) using Image J Software. Bars show the mean ± SEM.

