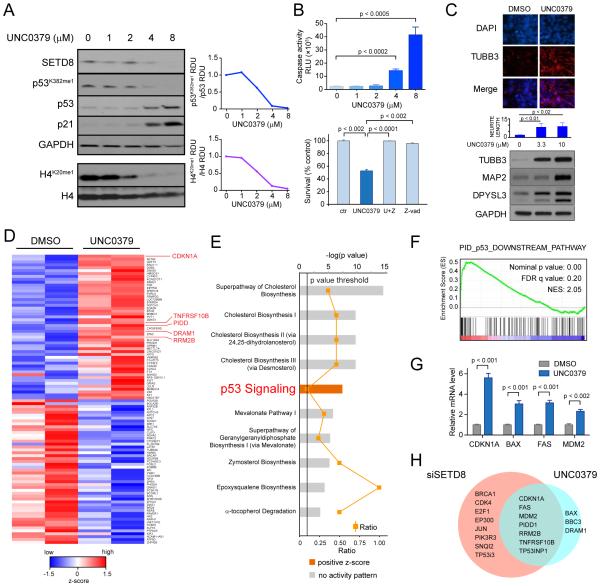
Figure 5. SETD8 pharmacological inhibition reduces cell growth and activates p53 proapoptotic and growth arrest functions in SY5Y cells.
(A) Western blot of SY5Y (MYCN-WT) cells treated with UNC0379 at the indicated concentrations (left panel). Densitometric analysis of p53K382me1 levels normalized to p53 protein levels (upper right) and of H4K20me1 levels normalized to H4 protein levels (lower right) after treatment with the SETD8 inhibitor, UNC0379, for 12 hr calculated as RDU using Image J Software.
(B) Caspase 3/7 activity upon SETD8 pharmacological inhibition for 12 hr in SY5Y cells. Bars show the mean ± SD of 3 replicates (upper graph). The effects of caspase inhibitor Z-VAD-FMK on UNC0379 treated SY5Y cells (lower graph). SY5Y cells were pretreated with 10 μM Z-VAD for 3 hr, followed by treatment with 10 μM UNC0379 for 48 hr, or treated with UNC0379 or Z-VAD alone for 48 hr. MTS assay was used to detect cell survival. Data represent mean ± SD of 2 independent experiments (p < 0.001).
(C) Immunofluorescence analysis showing the expression of TUBB3 (red) after treatment with 4 μM UNC0379 for 72 hr in SY5Y cells. Nuclei are stained with DAPI (blue). Scale bars, 100 μm (upper panel). Neurite length in SY5Y treated with 3.3 μM and 10 μM UNC0379 for 72 hr, measured by the Opera microscope. Bars represent the mean ± SD of 3 replicates (middle panel). Immunoblot of proteins from SY5Y cells treated with 3.3 μM and 10 μM UNC0379 for 72 hr and immunoblotted with antibodies to TUBB3, MAP2 and DPYSL3 (lower panel).
(D) Heatmap of the top 50 up- and down-regulated genes in SY5Y cells ranked by statistical significance following 12 hr of treatment with 4 μM (IC80) UNC0379. Data are presented as normalized expression values of 2 biological replicates based on edgeR software analysis and FDR < 0.001. The color key represents the normalized expression values: blue (high) to red (low).
(E) The top ten differentially expressed canonical pathways after SETD8 pharmacological inhibition defined by IPA (Ingenuity pathway analysis) based on edgeR software analysis and FDR < 0.001. Pathways related to p53 signaling are among top differentially expressed pathways.
(F) GSEA of the p53 downstream pathway (Nominal p value = 0.00, FDR = 0.20, NES = 2.05) after UNC0379 treatment.
(G) qRT-PCR analysis showing relative mRNA levels of the indicated genes after SETD8 pharmacological inhibition. Bars show mean ± SEM of 3 replicates.
(H) Venn diagram showing numbers of differentially expressed p53 target genes from genetic and pharmacological inhibition of SETD8.

