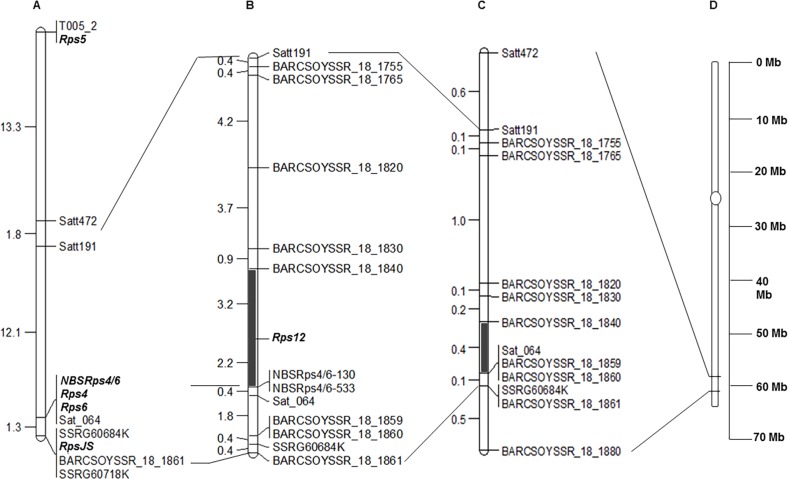
Fig 4. Genetic and physical map of the Rps12 region.
(A) Molecular genetic map of the Rps loci of the lower arm of Chromosome 18 (S1D Fig). (B) Genetic map of the Rps12 region. SSR markers are shown on the right side of the map and corresponding genetic distances between two adjacent loci are shown on the left side of the map in centi-Morgan (cM). The Rps12 region is shown with a solid line. (C) Physical map of SSR markers on Chromosome 18 according to the soybean reference genome sequence (Glycine max v1.1: http://soybase.org). The corresponding physical distances between two adjacent loci are shown on the left side of the map in mega base pairs (Mb). The Rps12 physical region defined by two molecular markers (BARCSOYSSR_18_1820 and Sat_064) is shown by a solid dark line. (D) Physical location of the Rps12 region on Chromosome 18 (Glycine max v1.1: http://soybase.org). The two long bars indicate two arms of Chromosome 18, the circle indicates the approximate position of the centromeric region, and the marked portion indicates the region containing Rps12.

