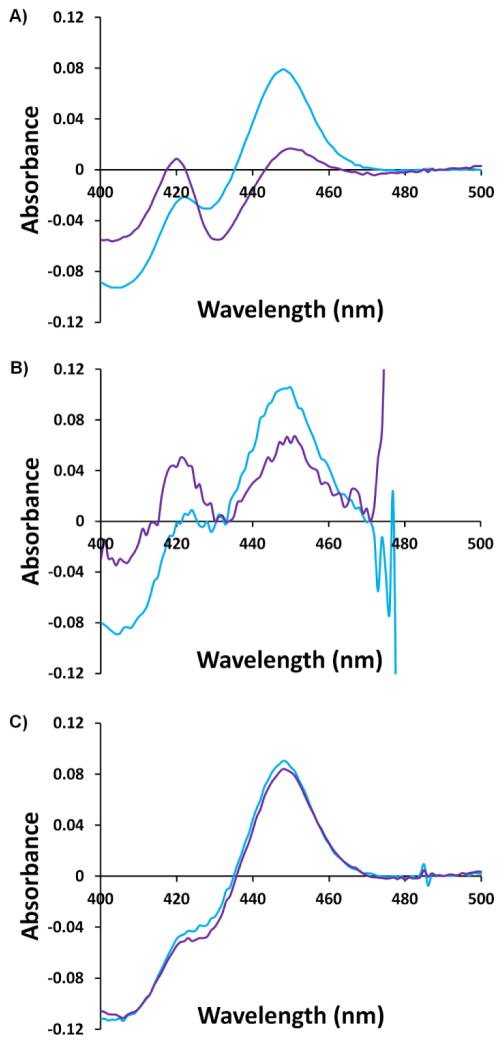
Figure 9.
Effect of labelling with maleimides 9d (A) and 2d (B) on the CO-difference spectrum of CYP3A4 mutant 3 compared to the non-labelled control (C). Each plot compares the CO-difference spectrum before (in blue) and after (in purple) labelling. The CO-difference spectra were acquired in the manner reported by Omura and Sato26. Note that 2d absorbs maximally in the region around 500 nm.

