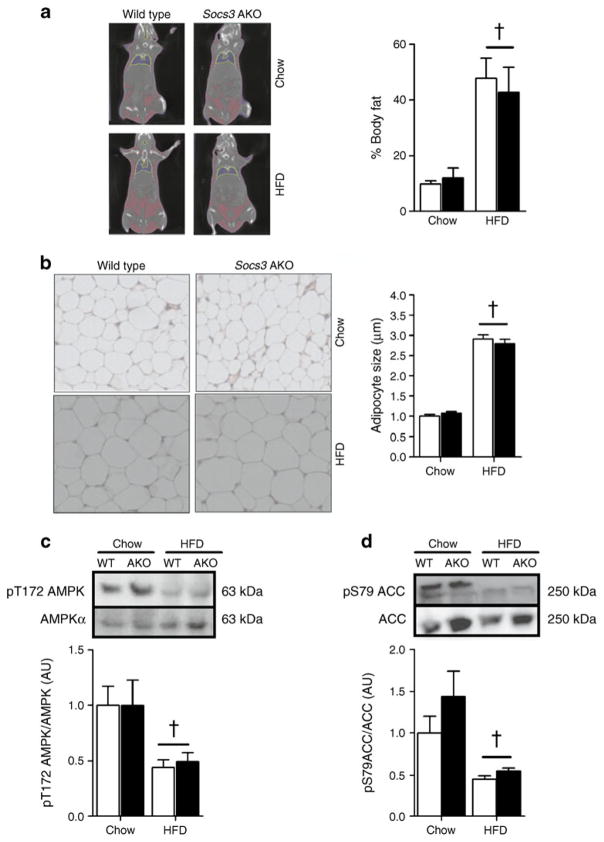
Fig. 2.
Adiposity, adipose tissue cell size and adipose-tissue AMPK activity is not altered in Socs3 AKO mice. (a) Body fat composition assessed by CT analysis (representative image with quantification). (b) Adipose tissue histology (haematoxylin and eosin [H&E] stain) from WT and Socs3 AKO mice fed chow and HFD (representative image with quantification of adipose-tissue cell size). Phosphorylation of AMPK T172 (c) and ACC S79 (d) in adipose tissue from WT and Socs3 AKO mice fed chow or HFD. White bars, WT mice; black bars, Socs3 AKO mice. AU, arbitrary units. Data are means ± SEM, n=6–8. †p<0.001 relative to chow control

