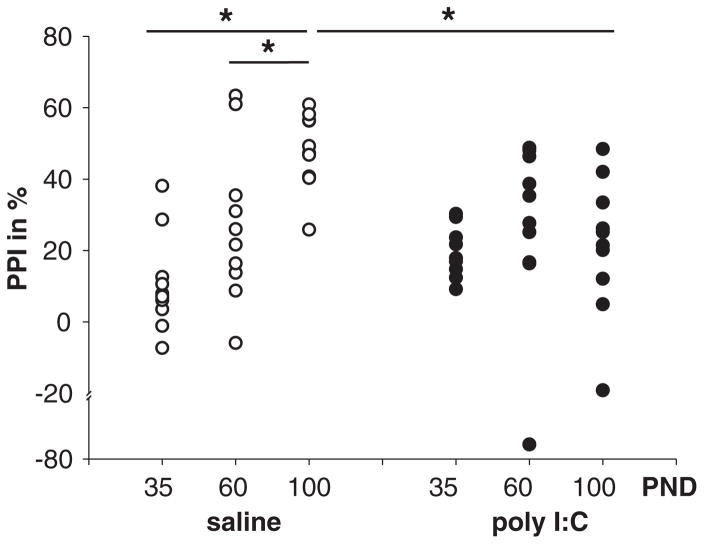
Fig. 1.
The developmental course of PPI in saline and poly I:C offspring. Offspring of saline and poly I:C treated dams were tested for PPI at PND35, PND60 and PND100. Vertical point plots depict the percentage of PPI inhibition (%PPI) in each animal for each condition. In saline rats (left) PPI develops over time: a significant difference between PND35 and PND100 as well as between PND60 and PND100 was found. In poly I:C rats (right) no significant differences were found over all time-course comparisons. Comparisons between saline and poly I:C offspring revealed a significant difference at PND100 but not between PND30 or PND60. Significant differences indicated by asterisks (*); p < 0.05.

