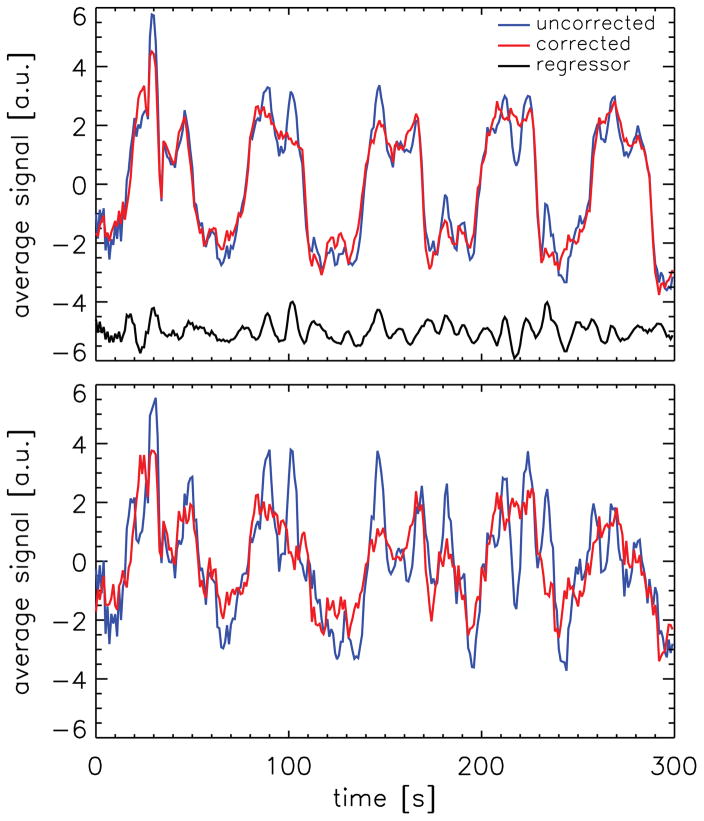
Figure 2.
Average signal time course in the activated voxels of one of the volunteers (volunteer 2) for original data (blue trace) and data from which the correlated noise, as determined by the method described here, was removed (red trace). The top panel shows the average for voxels that were significantly activated in the analysis without the correlated noise regressor, the bottom panel shows similar results for the voxels that were found to be significantly activated when the correction regressor was included in the analysis, but not in the analysis without it. The correction regressor used for this volunteer is shown in black in the top panel. (For figure clarity, an offset of −5 a.u. was used for this trace.)

