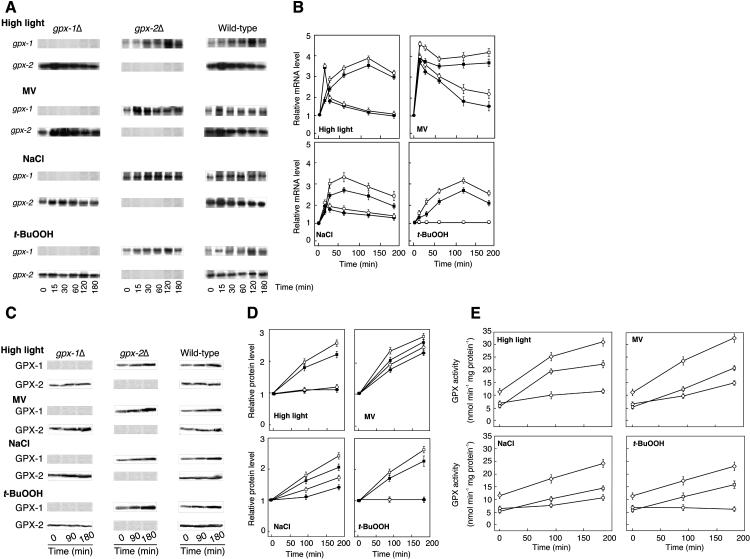
Figure 2.
The effect of various stress conditions on transcript and protein levels and activities of GPX-1 and GPX-2. A, Northern-blot analysis. Detailed conditions for experiments are described in “Materials and Methods.” B, Relative transcript levels of GPX-1 and GPX-2 in the wild-type and each type of mutant cells. The mRNA level of each sample was expressed as the mean value ± sd of three independent experiments. The value of each transcript level at zero time was set to 1. C, Immunoblot analysis. D, Relative levels of GPX-1 and GPX-2 proteins. The protein ratio in each sample was densitometrically quantified and presented as the mean value of three independent experiments. E, Enzyme activities. ▪, GPX-1 in wild-type cells; •, GPX-2 in wild-type cells; □, GPX-1 in gpx-2Δ mutant; ○, GPX-2 in gpx-1Δ mutant; ⋄, GPX-1 plus GPX-2 in wild-type cells.

