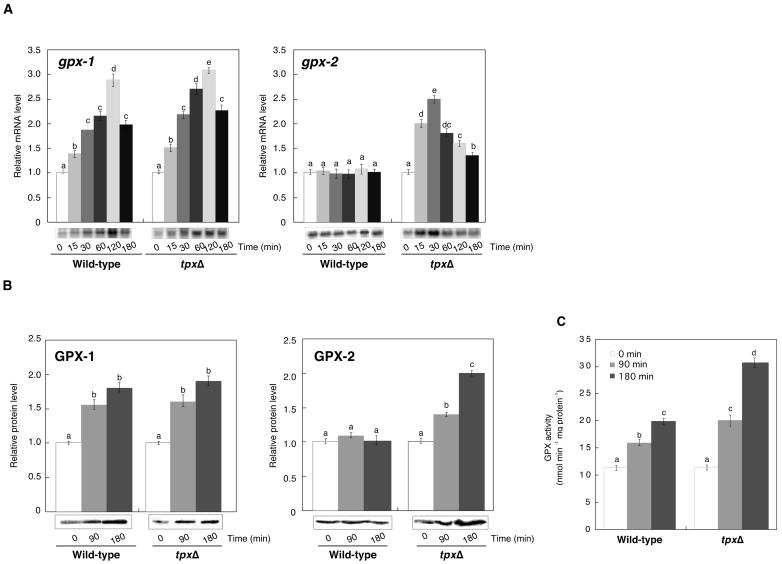
Figure 4.
Effect of tpx null mutation on the transcription, protein levels, and activities of GPX-1 and GPX-2 during treatment with t-BuOOH. A, Relative transcript levels of GPX-1 and GPX-2 in the tpxΔ mutant and wild-type cells. B, Relative levels of GPX-1 and GPX-2 proteins. C, NADPH-dependent GPX activities after treatment with 0.2 mm t-BuOOH for 3 h. The data are the mean value ± sd of three independent experiments. Different letters indicate that the mean values are significantly different from those of the cells at zero time (P < 0.05).

