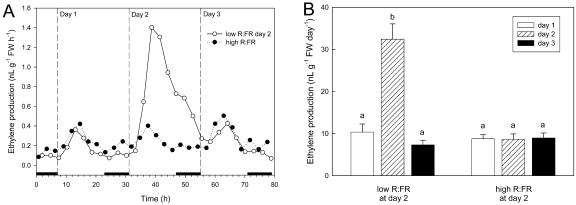
Figure 2.
Effects of R:FR of the incident light on ethylene production of wild-type tobacco. A, Patterns of ethylene production of individual representative plants in either the high or the low R:FR compartment. Black horizontal bars on the x axis indicate the dark periods. White symbol, Days 1 and 3, R:FR = 8.04; day 2, R:FR = 0.12. Black symbol, Days 1 to 3, R:FR = 8.04. B, Average ethylene production calculated over 24-h periods in a high (control) or a low (treatment) R:FR environment (data are means ± se [n = 5]). Note that the R:FR was lowered only at day 2 in the treatment group.

