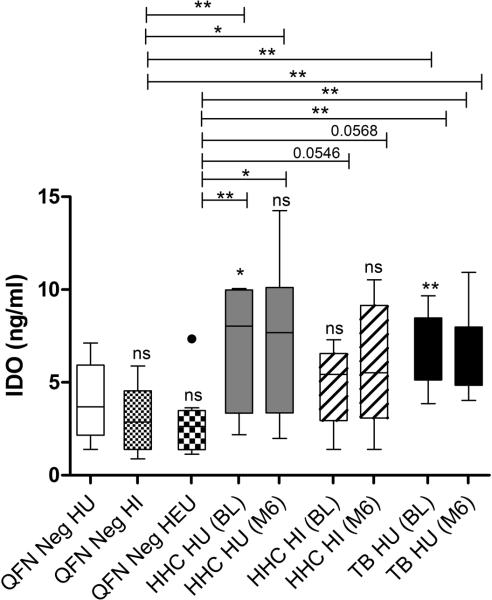
Figure 5.
Comparisons of IDO concentrations (ng/ml) in ex-vivo plasma of QFN negative controls without HIV exposure (n = 10), with HIV infection (n = 10) and HIV exposure uninfected (n = 10); Longitudinal assessments in M.tb infected HHC with (n = 10) and without (n = 10) HIV infection, and TB patients without (n = 9) HIV infection at baseline and month 6 time points. The horizontal line in each box represents the median, whiskers = 1.5 interquartile range (IQR) with points beyond 1.5IQR plotted individually. *P≤0.05; ** P ≤0.01;***P ≤0.001; ns = nonsignificant. Individual samples from each group were evaluated independently.

