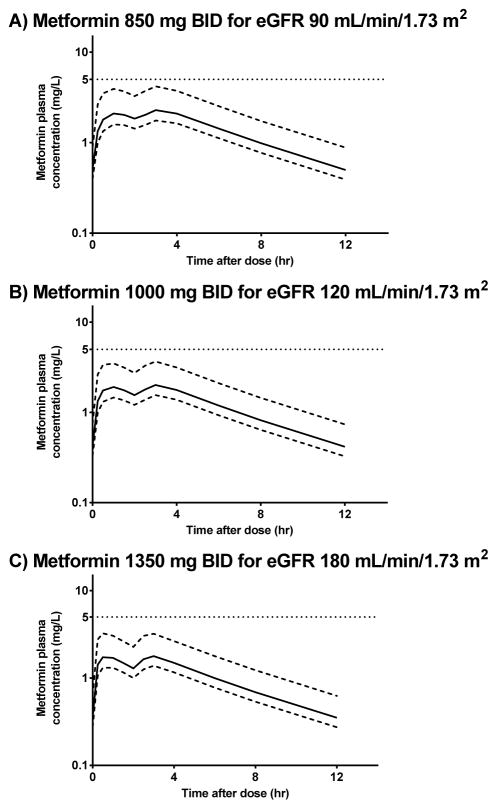
Figure 4. Simulations of the metformin plasma concentrations at A) 850 mg bid; B) 1000 mg bid; C) 1350 mg bid for pediatric patients with estimated glomerular filtration rates of 90, 120 and 180 mL/min/1.73 m2, respectively.
The 2.5th (lower dotted line), 50th (solid dotted line) and 97.5th (upper dotted line) percentiles of the simulated concentrations are shown.

