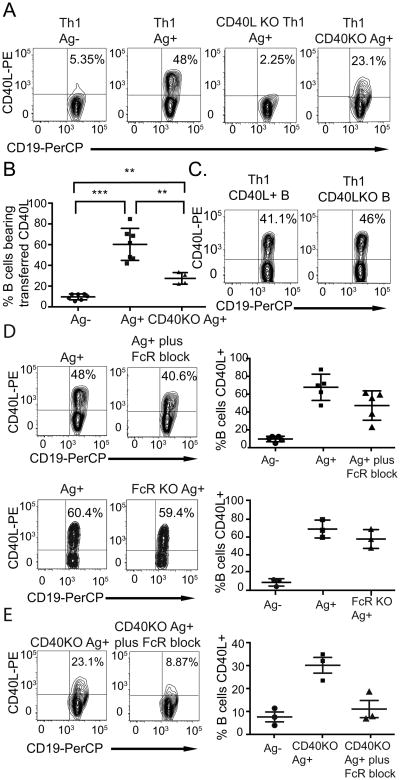
Figure 2. Enhanced detection of CD40L transfer in the presence of fluorescent anti-CD40L antibody.
(A, C) Each contour plot shows the percentage of B cells that have acquired CD40L following overnight incubation with Th1 cells in the presence of fluorescently labeled anti-CD40L antibody in a representative experiment. (B) The graph shows the results from seven independent experiments (mean +/- SD). p values were calculated using an unpaired, two-tailed Mann-Whitney test: Ag+ vs. Ag- p = 0.0006, Ag+ vs. CD40KO Ag+ p = 0.0061, Ag- vs. CD40KO Ag+ p = 0.0061. ** p ≤ 0.01, *** p ≤ 0.001. (D, E) Contour plots and graphs show the effects of CD40, FcR deficiency, and blocking anti-FcR antibody on detection of CD40L transfer. The graph shows the percentage of B cells bearing transferred CD40L in five (D top panels) or three individual experiments (D bottom panels, E) (mean +/- SD).

