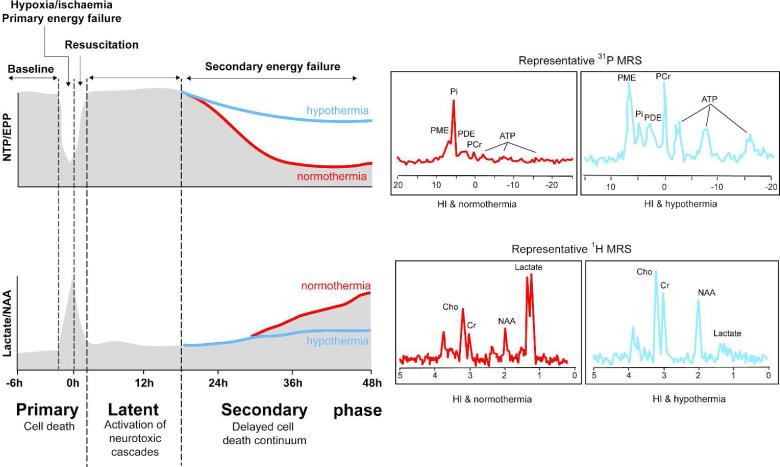
Figure 1.
Schematic diagram showing the phases of primary and secondary energy failure after hypoxia-ischemia on magnetic resonance spectroscopy (MRS), and the amelioration of secondary energy failure with therapeutic hypothermia started during the latent phase after transient hypoxia-ischemia in a newborn piglet. Upper panel shows phosphorus-31 MRS NTP/EPP peak area ratio at baseline, during and after hypoxia-ischemia. The preservation of high energy phosphates with hypothermia versus normothermia is shown on the diagram (blue line versus red line) and in the representative spectra at 48 h (red normothermia, blue hypothermia). Lower panel shows proton MRS lactate/NAA peak area ratio at baseline, and during and after hypoxia-ischemia. The amelioration of the rise in lactate/NAA with hypothermia versus normothermia is shown on the diagram (blue line versus red line) and in the representative spectra at 48 h (red normothermia, blue hypothermia). NTP: nucleotide tri-phosphate; EPP: exchangeable phosphate pool; NAA: N-acetyl aspartate.

