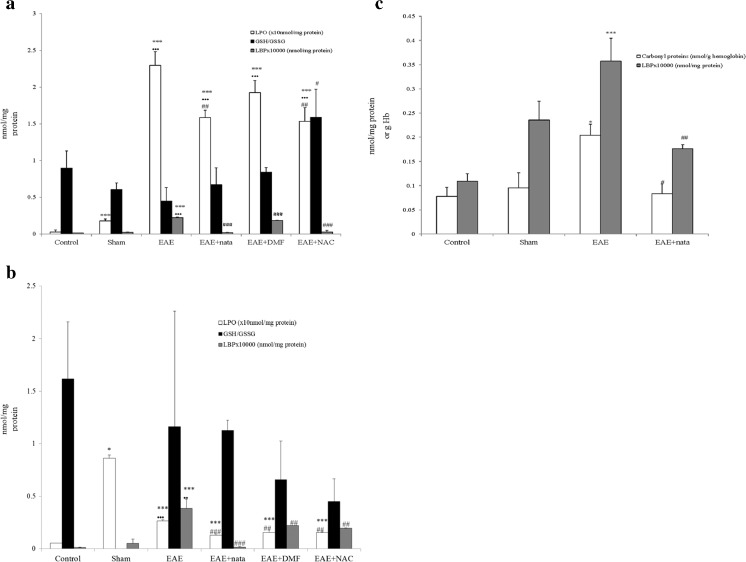
Fig. 2.
a Brain: mean ± SE in brain for the lipid peroxides (LPO; nmol/mg protein), reduced glutathione quotient (GSH; nmol/mg protein)/oxidized glutathione (GSSG nmol/mg protein), and the bacterial lipolysaccharide binding protein (LBP × 10,000 pg/mg protein). b Spinal cord: mean ± SE in the spinal cord for LPO (nmol/mg protein), GSH (nmol/mg protein)/GSSG (nmol/mg protein), and bacterial LBP (×10,000 pg/mg protein). c Blood: mean ± SE in blood for the carbonyl proteins (nmol/g hemoglobin), and bacterial LBP (×10,000 pg/mg protein). nmol/g Hb = nmol/g hemoglobin. All this was carried out for the different treatment groups: control, sham, experimental autoimmune encephalitis (EAE), EAE + natalizumab (EAE + nata), EAE + dimethyl fumarate (EAE + DMF), and EAE + N-acetylcysteine (EAE + NAC). ***p < 0.001 vs control; *p < 0.05 vs control; •••p < 0.001 vs sham; ••p < 0.01 vs sham; ### p < 0.001 vs EAE; ## p < 0.01 vs EAE; # p < 0.05 vs EAE

