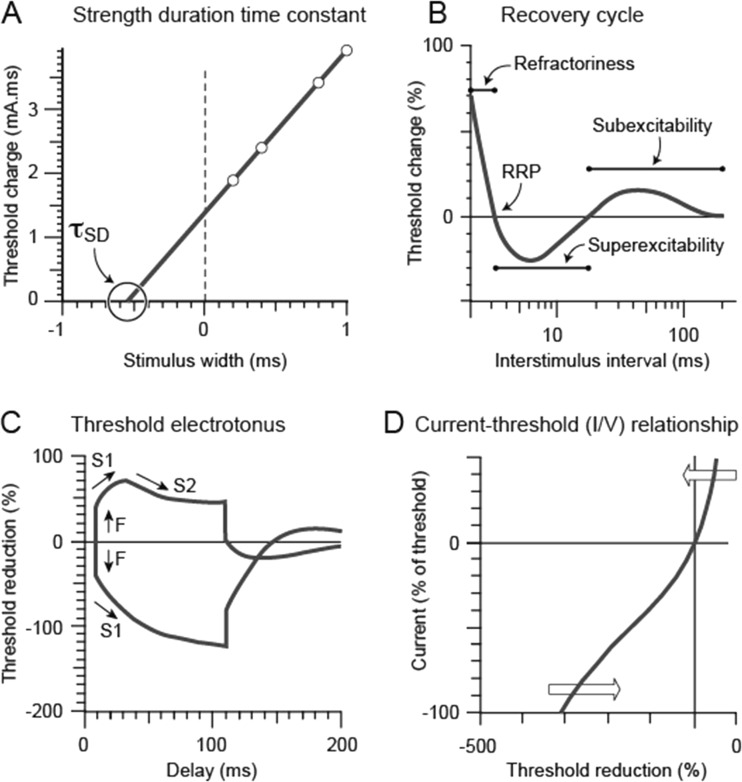
Fig. 2.
a Strength-duration time constant (τsd) plotted as the negative intercept on the x-axis of the linear relationship between stimulus width and threshold charge. b Recovery cycle plotted with the relative refractory period, superexcitability, and subexcitability depicted on the figure. c Threshold electrotonus in response to polarizing currents set to ± 40% of threshold. The initial response to polarization (F phase) is followed by a slow change in threshold (S1 phase), with threshold increase in the hyperpolarizing direction (plotted downwards) and threshold decrease in the depolarizing direction (plotted upwards), followed by accommodation to depolarization (S2 phase). d Current threshold (I/V) relationship plotted with response to depolarizing current in the upper right quadrant and response to hyperpolarizing current in the lower left quadrant

